Glossary-Definitions-Clinical Practice, Statistics and Research
By Ted Nissen M.A. M.T.
Copyright © May 2021 Ted Nissen
Abscissa. The horizontal or X axis of a graph.
Absolute Value. The value of a number without consideration of its algebraic sign.
Additive. Can legitimately be summed.
Anthropometry refers to the measurement of the human individual. An early tool of physical anthropology, it has been used for identification, for the purposes of understanding human physical variation, in paleoanthropology and in various attempts to correlate physical with racial and psychological traits. Wikipedia
Alpha Level The significance level α is the probability of making the wrong decision when the null hypothesis is true. Alpha levels (sometimes just called “significance levels”) are used in hypothesis tests. Usually, these tests are run with an alpha level of .05 (5%), but other levels commonly used are .01 and .10.
Alternative Hypothesis. The hypothesis that the mean of the population treated in a certain way is not equal to the mean of the population not treated in that way; symbolized HI, .
Analysis of Variance (ANOVA). A statistical method for determining the significance of the differences among a set of means. Analysis of variance (ANOVA) is an analysis tool used in statistics that splits an observed aggregate variability found inside a data set into two parts: systematic factors and random factors. The systematic factors have a statistical influence on the given data set, while the random factors do not. Analysts use the ANOVA test to determine the influence that independent variables have on the dependent variable in a regression study.
Annotated Bibliography- An annotated bibliography or annotated bib is a bibliography (a list of books or other works) that includes descriptive and evaluative comments about the sources cited in your paper. These comments are also known as annotations. A brief summary of the source. 1.) The source's strengths and weaknesses. 2.) Its conclusions. 3.) Why the source is relevant in your field of study. 4.) Its relationships to other studies in the field. 5.) An evaluation of the research methodology (if applicable) 6.) Information about the author's background Annotated Bibliography Annotated Bibliography Samples
anterior superior impingement (ASI) Anterosuperior glenoid impingement is a well known and well documented cause of shoulder pain, which occurs after deep surface tears of the subscapularis retract and subsequently become trapped between the anterosuperior glenoid and humeral head. Pain is typically elicited when the shoulder is flexed with internal rotation.
Asymptotic. A line that continually approaches but never reaches a specified level.
Bar Graph. A frequency graph for nominal or qualitative data. Bars are raised from each designation of a nominal variable on the X axis to the level of its frequency on the Y axis. Space is left between the bars.
Biased Sample. A sample that does not provide all members of the population an equal probability of selection.
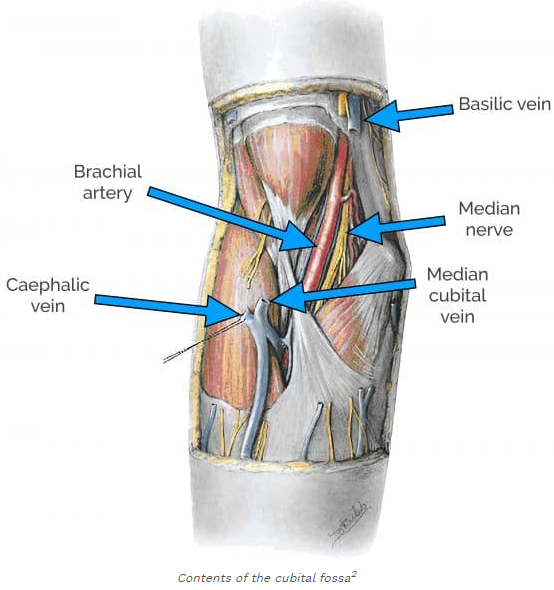
Biceps tendon The biceps tendon passes centrally through the cubital fossa and attaches to the radial tuberosity of the radius. The biceps tendon is relatively easy to identify by palpation and can be used as a useful landmark for the other contents of the cubital fossa. Furthermore, partial flexion of the elbow and voluntary contraction of the biceps muscle exaggerates the tendon’s appearance. Medial to the biceps tendon is the brachial artery and median nerve.1 Applying this knowledge to clinical practice allows easier identification of the brachial pulse which is typically used for blood pressure measurement.
Bimodal Distribution. A distribution with two modes.
Binomial Distribution. A distribution of events that have only two possible outcomes.
Bivariate Distribution. A joint distribution of two variables, the individual scores of which are paired in some logical way.
Cardinal Plane- The three cardinal planes are the sagittal, frontal, and transverse planes. The sagittal plane divides the body into right and left portions. The frontal plane divides the body into anterior and posterior portions. The transverse plane divides the body into right and left.
- A sagittal plane (saj´ĭ-tal; “arrow”) is a vertical plane that divides the body into right and left parts. A sagittal plane that lies exactly in the midline is the median plane, or midsagittal plane (Figure 1.9a). All other sagittal planes, offset from the midline, are parasagittal planes (para = near).
- Frontal planes, like sagittal planes, lie vertically. Frontal planes, however, divide the body into anterior and posterior parts (Figure 1.9b). A frontal plane is also called a coronal plane (kŏ-ro´nal; “crown”).
- A transverse, or horizontal, plane runs horizontally from right to left, dividing the body into superior and inferior parts (Figure 1.9c). Of course, many different transverse planes exist, at every possible level from head to foot. A transverse section is also called a cross section.
- Oblique sections are cuts made diagonally between the horizontal and the vertical planes. Because oblique sections are often confusing and difficult to interpret, they are seldom used.
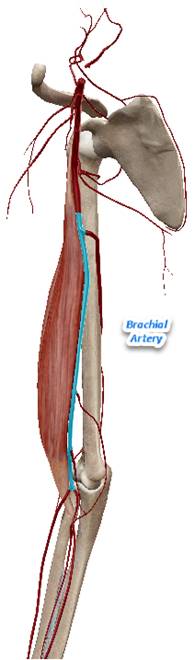 Brachial Artery (See Picture to left brachial Artery
In blue) The brachial artery (r, I), a continuation of the axillary artery (r,
I), provides blood supply to the arm. It commences at the lower margin of the
tendon of the teres major and passes down the arm, ending just below the bend
of the elbow, where it divides into the radial (r, I) and ulnar (r, I)
arteries. Initially, the brachial artery lies medial to the humerus, but as it
runs down the arm it gradually curves in front of the bone and courses into the
cubital fossa, a depression anterior to the elbow, creating an easily detectable pulse
point. The profunda brachii (r, I) branches from the brachial artery just below
the teres major and supplies the posterior triceps brachii muscle. Smaller
branches of the brachial artery serve the elbow joint.
Brachial Artery (See Picture to left brachial Artery
In blue) The brachial artery (r, I), a continuation of the axillary artery (r,
I), provides blood supply to the arm. It commences at the lower margin of the
tendon of the teres major and passes down the arm, ending just below the bend
of the elbow, where it divides into the radial (r, I) and ulnar (r, I)
arteries. Initially, the brachial artery lies medial to the humerus, but as it
runs down the arm it gradually curves in front of the bone and courses into the
cubital fossa, a depression anterior to the elbow, creating an easily detectable pulse
point. The profunda brachii (r, I) branches from the brachial artery just below
the teres major and supplies the posterior triceps brachii muscle. Smaller
branches of the brachial artery serve the elbow joint.
These branches and their extensions include: Ulnar collateral (r, I) Ulnar recurrent, posterior (r, I) Ulnar recurrent, anterior (r, I)
Measuring blood pressure The brachial pulse is key to measuring blood pressure manually with a sphygmomanometer. The brachial artery is first palpated and then auscultated to listen for Korotkoff sounds which appear and disappear during inflation and deflation of the sphygmomanometer allowing systolic and diastolic blood pressure to be measured.
Cell. The portion of an ANOV A table containing the scores of subjects treated alike.
Central Limit Theorem. The theorem in mathematical statistics that the sampling distribution of the mean approaches a normal curve as N gets larger, and that the standard deviation of this sampling distribution is equal to CT/VN.
The central limit theorem allows confidence intervals to be computed around the population mean from a single sample mean (Mood et al., 1974). In general, the central limit theorem states that when a number of different samples are drawn from the same population, the distribution of the sample means tends to be normally distributed. If you draw a sample from a population and calculate its mean, how close have you come to knowing the mean of the population? Statisticians have provided us with formulas that allow us to determine just how close the mean of our sample is to the mean of the population.
When many samples are drawn from a population, the means of these samples tend to be normally distributed; that is, when they are charted along a baseline, they tend to form the normal curve. The larger the number of samples, the more the distribution approximates the normal curve. Also, if the average of the means of the samples is calculated (the mean of the means), this average (or mean) is very close to the actual mean of the population. Again, the larger the number of samples, the closer this overall mean is to the population mean.
It also states that the SD of the distribution of the sample means (i.e., the standard error of the mean used in constructing confidence intervals) can be computed using this equation:
se ¯ ¯ ¯X = s√ n ( 3-17 )
The larger the sample size, the smaller the standard error (and thus the more accurate the measure). In general, the approximation to normality of the sampling distribution of the mean becomes better as the sample size increases. A sample size of 30 or greater has been found to be sufficient for the central limit theorem to apply (Vaughan, 1998).
Central Value. The mean, median, or mode; a statistic that describes the typical score in a distribution.
Chi Square Distribution. A theoretical sampling distribution of chi square values. There is a chi square distribution for each number of degrees of freedom.
Class Interval. A range of scores grouped together in a grouped frequency distribution.
Concentric Exercise Muscle contraction Muscle contraction is the activation of tension-generating sites within skeletal muscle fibers. In physiology, muscle contraction does not necessarily mean muscle shortening because muscle tension can be produced without changes in muscle length, such as when holding a heavy book or a dumbbell at the same position. The termination of muscle contraction is followed by muscle relaxation, which is a return of the muscle fibers to their low tension-generating state. concentric exercise - Bing images
Coefficient of Determination. A squared correlation coefficient; an estimate of common variance.
Common Variance. Variance held in common by two variables. It is assumed to be determined or caused by the same factors.
Confidence Interval. An interval of scores within which, with specified confidence, a parameter is expected to lie. Alpha levels can be controlled by you and are related to confidence levels. To get α subtract your confidence level from 1. For example, if you want to be 95 percent confident that your analysis is correct, the alpha level would be 1 – .95 = 5 percent, assuming you had a one tailed test. For two-tailed tests, divide the alpha level by 2. In this example, the two tailed alpha would be .05/2 = 2.5 percent. See: One-tailed test or two? for the difference between a one-tailed test and a two-tailed test. .
Confidence Limits. Two numbers that define the boundaries of a confidence interval.
Constant. A mathematical value that remains the same within a series of operations; for example, regression coefficients a and b have the same value for all predictions from the same regression line.
Control Group. A group in an experiment against which other groups are compared.
Correlated-Samples Design. An experimental design in which measures from different groups are not independent of each other. Some writers call this a dependent-samples design.
Correlation. A relationship between variables such that increases or decreases in the value of one variable tend to be accompanied by increases or decreases in the other.
Critical Region. The area of the sampling distribution that covers the values of the test statistic that are not due to chance.
Critical Value. The value from a sampling distribution against which a computed statistic is compared to determine whether the null hypothesis may be rejected.
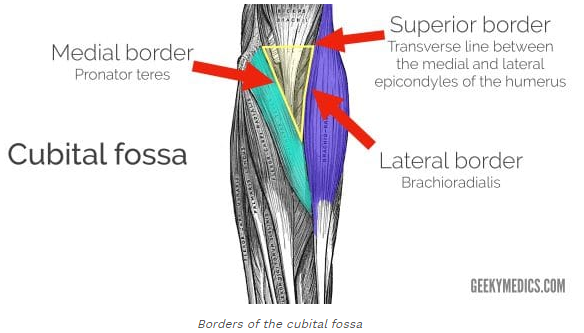 Cubital
Fossa The roof
of the cubital fossa is formed by fascia and skin. The roof of the fossa is
covered by the bicipital aponeurosis, which confers some protection to the
median nerve and brachial artery. The contents of the cubital fossa include the
median nerve, radial nerve, brachial artery and biceps tendon – these will be discussed in greater
detail below. A useful
mnemonic for remembering the contents of the cubital fossa ordered lateral to
medial is: ‘Really Need Beer To Be At My Nicest’ Radial Nerve Brachial Tendon Brachial
Artery Median Nerve. https://geekymedics.com/cubital-fossa/
Cubital
Fossa The roof
of the cubital fossa is formed by fascia and skin. The roof of the fossa is
covered by the bicipital aponeurosis, which confers some protection to the
median nerve and brachial artery. The contents of the cubital fossa include the
median nerve, radial nerve, brachial artery and biceps tendon – these will be discussed in greater
detail below. A useful
mnemonic for remembering the contents of the cubital fossa ordered lateral to
medial is: ‘Really Need Beer To Be At My Nicest’ Radial Nerve Brachial Tendon Brachial
Artery Median Nerve. https://geekymedics.com/cubital-fossa/
 A useful mnemonic for remembering the
contents of the cubital fossa ordered lateral to medial is: ‘Really Need Beer
To Be At My Nicest’ Radial Nerve Brachial Tendon Brachial Artery Median Nerve.
https://geekymedics.com/cubital-fossa/
A useful mnemonic for remembering the
contents of the cubital fossa ordered lateral to medial is: ‘Really Need Beer
To Be At My Nicest’ Radial Nerve Brachial Tendon Brachial Artery Median Nerve.
https://geekymedics.com/cubital-fossa/
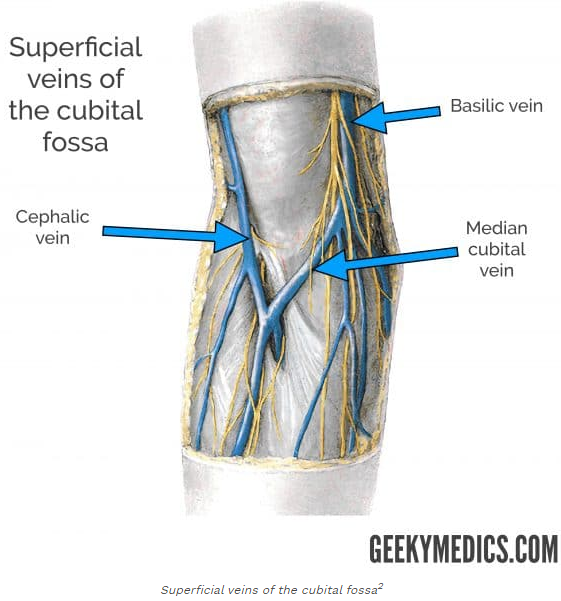
Superficial veins of the cubital fossa
The superficial veins of the cubital fossa lie superior to the roof of the fossa and are separated from the brachial artery and median nerve by the bicipital aponeurosis.
The superficial veins of the cubital fossa include the basilic vein located medially, the cephalic vein located laterally and the median cubital vein which connects these two veins together. Clinical relevance
Venepuncture and intravenous cannulation The superficial veins located superior to the cubital fossa are often used in procedures such as venepuncture and intravenous cannulation. The aponeurosis confers an element of protection to the brachial artery and median nerve in this instance.4Supracondylar fractures
A supracondylar fracture of the humerus is a relatively common fracture in children. The mechanism of injury is typically a fall onto an outstretched hand (FOOSH). As the elbow is hyper-extended in this instance, a fracture can occur between the medial and lateral epicondyles.6 The fracture is usually proximal to the epicondylar line, however, displaced fragments may cause injury to the contents of the cubital fossa. Impingement or injury to the brachial artery results in ischaemia to the forearm and hand which if not reversed or corrected can cause necrosis, fibrosis and shortening of forearm muscles resulting in Volkmann’s ischaemic contracture (disabling, irreversible flexion of the hand at the wrist and wrist pronation). Dialysis fistula construction Anatomical knowledge is essential for preventing iatrogenic injury during surgery. Patients in renal failure requiring dialysis undergo a procedure to create an arteriovenous fistula which is a connection between an artery and a vein. The brachial artery and cephalic vein are commonly used to create an arteriovenous fistula.1 Haemodialysis allows large volumes of blood to be removed, filtered in the dialyzer and returned to the body through the fistula. This vein must be large enough to withstand the higher pressures associated with the arterial circulation.
Cytokines any of a number of substances, such as interferon, interleukin, and growth factors, which are secreted by certain cells of the immune system and have an effect on other cells. Proinflammatory Cytokine An inflammatory cytokine or proinflammatory cytokine is a type of signaling molecule (a cytokine) that is secreted from immune cells like helper T cells (Tₕ) and macrophages, and certain other cell types that promote inflammation. They include interleukin-1 (IL-1), IL-12, and IL-18, tumor necrosis factor alpha (TNF-α), interferon gamma (IFNγ), and granulocyte-macrophage colony stimulating factor (GM-CSF) and play an important role in mediating the innate immune response. Inflammatory cytokines are predominantly produced by and involved in the upregulation of inflammatory reactions. An inflammatory cytokine or proinflammatory cytokine is a type of signaling molecule (a cytokine) that is secreted from immune cells like helper T cells (Th) and macrophages, and certain other cell types that promote inflammation. They include interleukin-1 (IL-1), IL-12, and IL-18, tumor necrosis factor alpha (TNF-α), interferon gamma (IFNγ), and granulocyte-macrophage colony stimulating factor (GM-CSF) and play an important role in mediating the innate immune response. Inflammatory cytokines are predominantly produced by and involved in the upregulation of inflammatory reactions.
Excessive chronic production of inflammatory cytokines contribute to inflammatory diseases, that have been linked to different diseases, such as atherosclerosis and cancer. Dysregulation has also been linked to depression and other neurological diseases. A balance between proinflammatory and anti-inflammatory cytokines is necessary to maintain health. Aging and exercise also play a role in the amount of inflammation from the release of proinflammatory cytokines.
Therapies to treat inflammatory diseases include monoclonal antibodies that either neutralize inflammatory cytokines or their receptors.
Degrees of Freedom. The number of observations minus the number of necessary relations obtaining among these observations.
Dependent Variable. The variable that is measured and analyzed in an experiment. Its values are tested to determine whether they are dependent upon values of the independent variable.
Descriptive Statistic. Index number that summarizes or describes a set of data.
Deviation Score. A raw score minus the mean of the distribution from which the raw score was drawn.
Dichotomous Variable. A variable taking two, and only two, values.
Distribution-Free Statistics. Statistical methods that do not assume any particular population distribution.
Empirical Distribution. An arrangement from highest to lowest of actual scores from real observations. .
Endnote-Note citing a particular source or making a brief explanatory comment placed at the end of a research paper and arranged sequentially in relation to where the reference appears in the paper.
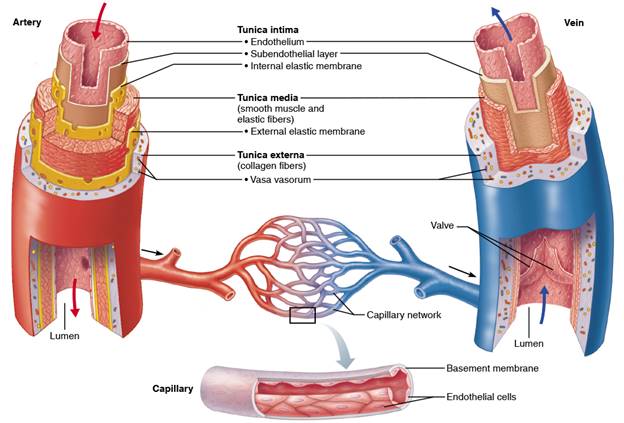
Endothelial- See illustration to left. Same as epithelium except for the tissue which forms a single layer of cells lining various organs and cavities of the body, especially the blood vessels, heart, and lymphatic vessels. It is formed from the embryonic mesoderm. Compare with epithelium.
 Endothelial- See above Illustration. Same as epithelium except for
the tissue which forms a single layer of cells lining various organs and
cavities of the body, especially the blood vessels, heart, and lymphatic
vessels. It is formed from the embryonic mesoderm. Compare with epithelium.
Endothelial- See above Illustration. Same as epithelium except for
the tissue which forms a single layer of cells lining various organs and
cavities of the body, especially the blood vessels, heart, and lymphatic
vessels. It is formed from the embryonic mesoderm. Compare with epithelium.
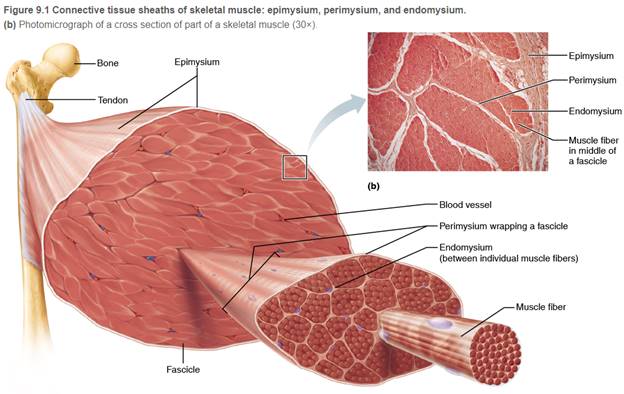
Epimysium Skeletal muscle is also known as voluntary muscle because it is under the voluntary control of the somatic nervous system so all the movements you think about doing are carried out by skeletal muscles. Most skeletal muscles are attached to bone as we can see here in our illustration. As you already know, the bones of the skeleton are connected to one another via joints, and if a muscle crosses a joint, it performs movements of that joint. Muscles are attached to bone via tendons which are predominantly composed of collagen. Tendons are extremely strong allowing them to withstand the stresses generated by muscular contraction. Now we're going to look at how skeletal muscle is
 packaged up inside the body.
Epimysium. The epimysium
(ep0ĭ-mis´e-um; “outside the muscle”) is an “overcoat” of dense irregular
connective tissue that surrounds the whole muscle. Sometimes it blends with the
deep fascia that lies between neighboring muscles or the superficial fascia
deep to the skin (p. 151).Perimysium and fascicles. Within each skeletal
muscle, the muscle fibers are grouped into fascicles (fas9ĭ-klz;
“bundles”) that resemble bundles of sticks. Surrounding each fascicle is a
layer of dense irregular connective tissue called perimysium (per0ĭ-mis´e-um;
“around the muscle”).Endomysium. The endomysium (en˝en-mis´e-um; “within
the muscle”) is a wispy sheath of connective tissue that surrounds each
individual muscle fiber. It consists of fine areolar connective tissue.
Starting from the outside and working our way inwards, the first connective
tissue layer we can see is the deep fascia of the skeletal muscle. This is a
layer of dense connective tissue that surrounds individual muscles or groups of
muscles to separate them into fascial compartments. For example, if we look at
this cross-section, we can see that the thigh is divided into the anterior,
posterior, and medial fascial compartments by these layers of deep fascia. The
next layer we see is the epimysium which surrounds the entire muscle belly and
is composed of dense, irregular connective tissue. So here we can see the pink
muscle fibers with their purple nuclei and surrounding them is this irregular
connective tissue highlighted in green which is the epimysium. Deep to the
epimysium, we have the perimysium, also
packaged up inside the body.
Epimysium. The epimysium
(ep0ĭ-mis´e-um; “outside the muscle”) is an “overcoat” of dense irregular
connective tissue that surrounds the whole muscle. Sometimes it blends with the
deep fascia that lies between neighboring muscles or the superficial fascia
deep to the skin (p. 151).Perimysium and fascicles. Within each skeletal
muscle, the muscle fibers are grouped into fascicles (fas9ĭ-klz;
“bundles”) that resemble bundles of sticks. Surrounding each fascicle is a
layer of dense irregular connective tissue called perimysium (per0ĭ-mis´e-um;
“around the muscle”).Endomysium. The endomysium (en˝en-mis´e-um; “within
the muscle”) is a wispy sheath of connective tissue that surrounds each
individual muscle fiber. It consists of fine areolar connective tissue.
Starting from the outside and working our way inwards, the first connective
tissue layer we can see is the deep fascia of the skeletal muscle. This is a
layer of dense connective tissue that surrounds individual muscles or groups of
muscles to separate them into fascial compartments. For example, if we look at
this cross-section, we can see that the thigh is divided into the anterior,
posterior, and medial fascial compartments by these layers of deep fascia. The
next layer we see is the epimysium which surrounds the entire muscle belly and
is composed of dense, irregular connective tissue. So here we can see the pink
muscle fibers with their purple nuclei and surrounding them is this irregular
connective tissue highlighted in green which is the epimysium. Deep to the
epimysium, we have the perimysium, also 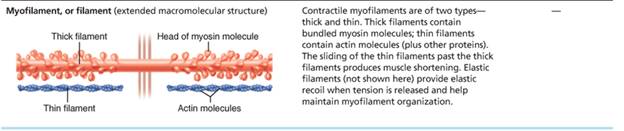 known as the interfascicular
connective tissue, which divides the muscle belly into fascicles. If we look at
our histological slide, we can see how the perimysium is continuous with and
essentially an extension of the epimysium. The last connective tissue layer
we're going to talk about is the endomysium, which divides the muscle fascicles
into individual muscle fibers. Again, we can see this really nicely under the
microscope. Here we have an individual muscle fiber, and surrounding it, we can
see the endomysium. You can find more about the structure of tendons in our
dedicated study unit. The muscle belly is surrounded by the epimysium. The muscle belly is then divided into
muscle fascicles by the perimysium. Muscle fascicles are further divided into
individual muscle
known as the interfascicular
connective tissue, which divides the muscle belly into fascicles. If we look at
our histological slide, we can see how the perimysium is continuous with and
essentially an extension of the epimysium. The last connective tissue layer
we're going to talk about is the endomysium, which divides the muscle fascicles
into individual muscle fibers. Again, we can see this really nicely under the
microscope. Here we have an individual muscle fiber, and surrounding it, we can
see the endomysium. You can find more about the structure of tendons in our
dedicated study unit. The muscle belly is surrounded by the epimysium. The muscle belly is then divided into
muscle fascicles by the perimysium. Muscle fascicles are further divided into
individual muscle
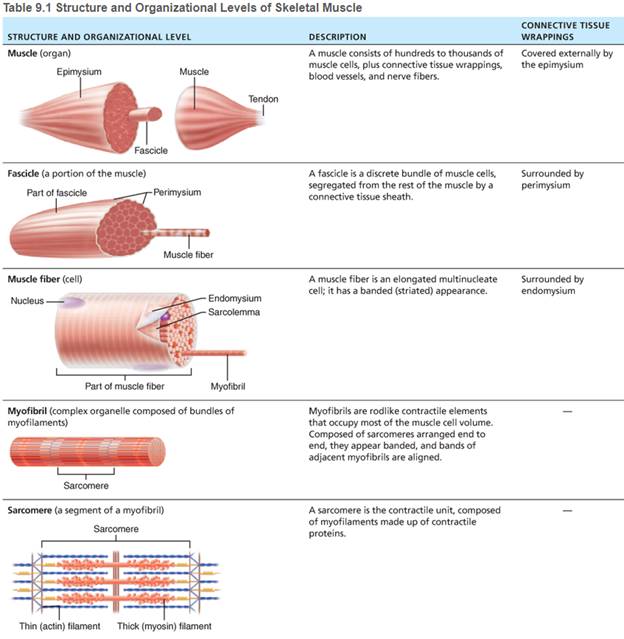
fibers by the endomysium. Now that we've seen how skeletal muscle is organized, let's look at our muscle fibers in a bit more detail. Each skeletal muscle fiber is one long multinucleated cell known as a myocyte, which is formed by the fusion of myoblasts. In our previous histological slide, we saw these fibers in cross-section, but in this image, we can get a better appreciation of how long muscle fibers are. Here we can see the nuclei of the skeletal muscle fibers highlighted in green. In this illustration, it might look like each muscle fiber has only one nucleus; however, if we go back to our previous slide, we can see that they are actually multinucleated with purple nuclei dotted along their length. Our next histological slide shows the fibers in cross-section. I'm showing you this slide again so that we can see how the nuclei of the muscle cells are located on the periphery of the muscle fiber which is characteristic of this type of muscle tissue. Muscle fibers are composed of myofibrils which are made up of contractile units known as sarcomeres. We can see how each muscle fiber is composed of numerous myofibrils in our histological slide. Within the myofibril, there are various proteins that interact with each other to generate contractions. These proteins are organized into thick and thin myofilaments which give skeletal muscle its striated appearance under the microscope. The thick filaments are composed of myosin and the thin filaments are composed of actin. As I mentioned previously, sarcomeres are the contractile units found in skeletal muscle. Let's look at the components of the sarcomere in more detail. Highlighted in green, we can see the Z-discs, which divide each myofibril into a series of sarcomeres. So they mark the beginning and end of each sarcomere. The Z-discs also act as an anchoring point for the thin filaments. If we look at this histological slide, we can see these structures quite nicely. Here's a sarcomere and here's another, and between them, we can see the Z-disc. Next, we're going to look at the A-band, which is marked or measured by the length of a thick myosin filament but also contains overlapping thin actin filaments. If we look at skeletal muscle fibers under the microscope, we can see that they have a striated appearance that distinguishes them from other muscle types. We mentioned earlier that this is due to the organization of the myofilaments. Here we can see the A-bands which stain darker than the alternating lighter bands. The lighter bands are called the I-bands and are formed by the thin myofilament actin. I-bands don't contain the entire length of the thin filaments but are the sections of the thin filament where no thick filament is present. Therefore, there is no myosin in this region. We can also see these bands on our histological slide. As we'll see later in our tutorial, the thick and thin filaments actually interdigitate with one another. However, the central paler region of the A-band does not contain thin filaments and is called the H-zone. Within the H-zone is a thin M-line, which is the attachment point for the thick myosin filaments.
Epithelium- is one of the four basic types of animal tissue, along with connective tissue, muscle tissue and nervous tissue. It is a thin, continuous, protective layer of cells. Epithelial tissues line the outer surfaces of organs and blood vessels throughout the body, as well as the inner surfaces of cavities in many internal organs. An example is the epidermis, the outermost layer of the skin. There are three principal shapes of epithelial cell: squamous, columnar, and cuboidal. These can be arranged in a single layer of cells as simple epithelium, either squamous, columnar, or cuboidal, or in layers of two or more cells deep as stratified (layered), or compound, either squamous, columnar or cuboidal. In some tissues, a layer of columnar cells may appear to be stratified due to the placement of the nuclei. This sort of tissue is called pseudostratified. All glands are made up of epithelial cells. Functions of epithelial cells include secretion, selective absorption, protection, trans cellular transport, and sensing. Epithelial layers contain no blood vessels, so they must receive nourishment via diffusion of substances from the underlying connective tissue, through the basement membrane. Cell junctions are well employed in epithelial tissues.
Error Variance. Variance due to factors not controlled in the experiment; within-group variance.
Eccentric exercise Eccentric exercise or resistance training is currently being used as a form of rehabilitation for sport injuries, but also as an alternative form of exercise for the elderly, those affected by neurological disorders, COPD, cardiopulmonary disorders, and cancer. Muscle loss is a big problem faced by the people afflicted with the above disorders and many cannot participate in rigorous exercise protocols. Eccentric muscle contractions produce high forces with low-energy cost. According to Hortobágyi due to these properties eccentric exercise has the greatest potential for muscle strengthening. To strengthen muscle the external force must exceed the muscle while it lengthens. The definition of eccentric contraction is almost the exact definition of muscle strengthening. Perceived Muscle Damage: There is a stipulation regarding eccentric contractions in that they actually cause muscle damage and injury. Eccentric contraction may result in delayed onset muscle soreness however; the contraction itself does not cause muscle damage or injury. eccentric exercise - Bing images
Exercise-induced muscle injury (EMI)- in humans frequently occurs after unaccustomed exercise, particularly if the exercise involves a large amount of eccentric (muscle lengthening) contractions. Direct measures of exercise-induced muscle damage include cellular and subcellular disturbances, particularly Z-line streaming.
Expected Value. The mean value of a random variable over an infinite number of samplings. The expected value of a statistic is the mean of the sampling distribution of the statistic.
Experimental Group. A group that receives a treatment in an experiment and whose dependent variable scores are compared with those of a control group.
Extracellular signal-regulated kinases In molecular biology, extracellular signal-regulated kinases (ERKs) or classical MAP kinases are widely expressed protein kinase intracellular signalling molecules that are involved in functions including the regulation of meiosis, mitosis, and postmitotic functions in differentiated cells. Many different stimuli, including growth factors, cytokines, virus infection, ligands for heterotrimeric G protein-coupled receptors, transforming agents, and carcinogens, activate the ERK pathway. The term, "extracellular signal-regulated kinases", is sometimes used as a synonym for mitogen-activated protein kinase (MAPK), but has more recently been adopted for a specific subset of the mammalian MAPK family.[citation needed] In the MAPK/ERK pathway, Ras activates c-Raf, followed by mitogen-activated protein kinase kinase (abbreviated as MKK, MEK, or MAP2K) and then MAPK1/2 (below). Ras is typically activated by growth hormones through receptor tyrosine kinases and GRB2/SOS, but may also receive other signals. ERKs are known to activate many transcription factors, such as ELK1,[1] and some downstream protein kinases. Disruption of the ERK pathway is common in cancers, especially Ras, c-Raf, and receptors such as HER2
Extraneous Variable. A variable, other than the independent variable, that may affect the dependent variable.
F Distribution. A theoretical sampling distribution of F values. There is a different F distribution for each combination of degrees of freedom.
flow-mediated dilation (FMD) Flow-mediated dilation (FMD) refers to dilation (widening) of an artery when blood flow increases in that artery. The primary cause of FMD is release of nitric oxide by endothelial cells. To determine FMD, brachial artery dilation following a transient period of forearm ischemia is measured using ultrasound. https://en.wikipedia.org/wiki/Flow-mediated_dilation#:~:text=Flow%2Dmediated%20dilation%20(FMD),ischemia%20is%20measured%20using%20ultrasound
Focal adhesion kinase (FAK) FAK activity elicits intracellular signal transduction pathways that promote the turn-over of cell contacts with the extracellular matrix, promoting cell migration. ... FAK is a protein of 125 kD recruited as a participant in focal adhesion dynamics between cells, and has a role in motility and cell survival.
F Test. A method of determining the significance of the difference among two or more means.
Factor. Independent variable.
Factorial Design. An experimental design using two or more levels of two or more factors and permitting an analysis of interaction effects between independent variables.
Footnote-Note citing a particular source or making a brief explanatory comment placed at the bottom of a page corresponding to the item cited in the corresponding text above.
Frequency. The number of times a score occurs in a distribution.
Frequency Polygon. A graph with quantitative scores on the X axis and frequencies on the
functional/microinstability leading to RC tendinosis/tendinopathy- The overhead throwing athlete is an extremely challenging patient in sports medicine. The repetitive microtraumatic stresses and extreme ranges of motion observed within the athlete’s shoulder joint complex during the throwing motion constantly place the athlete at risk for injury. https://www.ncbi.nlm.nih.gov/pmc/articles/PMC3811734/
Y axis. Each point on the graph represents a score and the frequency of occurrence of that score. Points are connected by a line.
Goodness of Fit. Degree to which observed data coincide with theoretical expectations.
Grand Mean. The mean of all the scores in an experiment.
Grouped Frequency Distribution. An arrangement of scores from highest to lowest in which scores are grouped together into equal-sized ranges called class intervals. The number of scores occurring in each class interval is placed in a column beside the appropriate Class interval.
Hawthorne Effect-The Hawthorne Effect refers to the fact that people will modify their behavior simply because they are being observed. The effect gets its name from one of the most famous industrial history experiments that took place at Western Electric's factory in the Hawthorne suburb of Chicago in the late 1920s and early 1930s. The Hawthorne Effect occurs when individuals adjust their behaviour as a result of being watched or observed. For instance, employees may work harder and more diligently knowing their manager is closely watching, or children behave better because they are being watched by their parents.
Hyperemia Active hyperemia happens when there’s an increase in the blood supply to an organ. This is usually in response to a greater demand for blood — for example, if you’re exercising.
Passive hyperemia is when blood can’t properly exit an organ, so it builds up in the blood vessels. This type of hyperemia is also known as congestion.
HHistogram. A graph with quantitative scores on the X axis and frequencies on the
Y axis. A bar covering the range from the lower to upper limit of each score or class interval is raised to the level of that score's frequency. There is no space between the bars.
Hypothesis. A statement about the relationship between two or more phenomena.
Hypothesis Testing. The process of hypothesizing a parameter and comparing (or testing) the parameter with an empirical statistic in order to decide whether the parameter is reasonable. Hypothesis Testing Tutorial
Independent. Events that have nothing to do with each other. Occurrence or variation of one does not affect the occurrence or variation of the other. Two sets of uncorrelated scores are
independent of each other.
Independent-Samples Design. An experimental design using samples whose dependent-variable scores cannot logically be paired.
Independent Variable. The treatment variable; it is selected by the experimenter.
Inferential Statistics. A method of deciding between two or more alternative conclusions.
Interaction. A relationship between two factors such that the effect of one treatment on the dependent variable depends upon the level of the other treatment.
Intracellular signal transduction pathways In most cases, a chain of reactions transmits signals from the cell surface to a variety of intracellular targets—a process called intracellular signal transduction. ... Intracellular signaling pathways thus connect the cell surface to the nucleus, leading to changes in gene expression in response to extracellular stimuli.
Interpolation. A method for determining a value known to lie between two other values.
interquartile range (IQR)- The IQR describes the middle 50% of values when ordered from lowest to highest. To find the interquartile range (IQR), first find the median (middle value) of the lower and upper half of the data. These values are quartile 1 (Q1) and quartile 3 (Q3). Interquartile range
Interval Scale. A measurement scale in which equal differences between numbers stand for equal differences in the thing measured. The zero point is arbitrarily defined.
Least-Squares Solution. Method of fitting a regression line such that the sums of the squared deviations from the straight regression line will be a minimum.
Level. A treatment chosen from an independent variable.
Level of Confidence. The confidence (1 - a) that a parameter lies within a given interval.
Level of Significance. The probability level at which the null hypothesis is rejected.
Line Graph. A graph presenting the relationship between two variables.
Linearity. The condition wherein the "line of best fit" through a scatterplot is a straight line. Lower Limit. The bottom of the range of possible values that a score on a quantitative variable
can take; for example, a score of 5 has 4.5 as its lower limit.
Main Effect. The deviation of one or more treatment means from the grand mean.
Mann-Whitney U Test. A nonparametric method used to determine whether two sets of ranked data based on two independent samples came from the same population.
Matched Pairs. A correlated-samples design in which pairs of scores are matched.
Mean. The arithmetic average; the sum of the scores divided by the number of scores.
Mean Square. An ANOV A term for the variance; a sum of squares divided by its degrees of freedom.
Mechanotransduction refers to the processes through which cells sense and respond to mechanical stimuli by converting them to biochemical signals that elicit specific cellular responses.
Median. The point that divides a distribution of scores into two equal halves, so that half the scores are above the median and half are below it.
Median nerve The median nerve lies most medially within the cubital fossa, immediately medial to the brachial artery. The median nerve exits the cubital fossa between the two heads of the ulnar and humeral heads of pronator teres.3 After leaving the cubital fossa, the median nerve runs down the forearm to sit deep or just lateral to the palmaris longus at the wrist. The median nerve has an important role in wrist flexion, forearm pronation and movements of the digits by innervating most of the muscles of the anterior compartment of the forearm.
As a side note; the ulnar nerve does not pass through the cubital fossa. The ulnar nerve passes down the medial side of the forearm through the cubital tunnel and passes posteriorly to the medial epicondyle to enter the anterior forearm.
Meta-Analysis -What Is a Meta-Analysis? There are several ways that individual studies can be summarized to help healthcare workers make decisions, including narrative reviews, systematic reviews, and meta-analyses. Both narrative and systematic reviews are both qualitative in nature. Narrative reviews are not very rigorous, but they focus on the very basics of a topic. Systematic reviews are more rigorous than narrative reviews; they focus on a single research question. For example, a systematic review will focus specifically on the relationship between cervical cancer and long-term use of oral contraceptives, while a narrative review may be about cervical cancer. Meta-analyses are quantitative and more rigorous than both types of reviews. In addition to providing an overview, these papers provide a quantitative assessment of how well a treatment works or they may also provide an estimate of how much more likely a person is to develop a disease if they participate in a certain behavior.
Mitochondrial biogenesis signaling potentiated mitochondrial biogenesis signaling The dynamics of mitochondrial biogenesis and function is a complex interplay of cellular and molecular processes that ultimately shape bioenergetics capacity. Mitochondrial mass, by itself, represents the net balance between rates of biogenesis and degradation. Mitochondrial biogenesis is dependent on different signaling cascades and transcriptional complexes that promote the formation and assembly of mitochondria—a process that is heavily dependent on timely and coordinated transcriptional control of genes encoding for mitochondrial proteins. In this article, we discuss the major signals and transcriptional complexes, programming mitochondrial biogenesis, and bioenergetic activity. This regulatory network represents a new therapeutic window into the treatment of the wide spectrum of mitochondrial and neurodegenerative diseases characterized by dysregulation of mitochondrial dynamics and bioenergetic deficiencies. Mitochondrial Biogenesis through Activation of Nuclear Signaling Proteins
Mode. The score that occurs most frequently in a distribution.
Multiple Comparisons. Tests of differences between treatment means or combinations of means following an ANOV A.
Multiple Correlation. A correlation method that combines intercorrelations among more than two variables into a single statistic.
Natural Pairs. A correlated-samples design, in which pairing occurs prior to the experiment.
nuclear factor kappaB Nuclear factor kappa B (NF-κB) is an ancient protein transcription factor (Salminen et al., 2008) and considered a regulator of innate immunity (Baltimore, 2009). The NF-κB signaling pathway links pathogenic signals and cellular danger signals thus organizing cellular resistance to invading pathogens.
Nuclear accumulation A common mechanism by which the tumor suppressor p53 accumulates in the nucleus following cellular stress is through the attenuation of its interaction with MDM2, a protein involved in the nuclear export and degradation of p53. This is accomplished by induced modifications of p53, MDM2 or both.
Nitroglycerin-induced dilation Nitroglycerine- induced vasodilation, an index of endothelium-independent vasodilation, assessed by sublingual administration of nitroglycerine, has been used as a control test for FMD measurement to differentiate endothelium-dependent from endothelium-independent vasodilation because both endog- enous Nitroglycerine-induced vasodilation has been used as a control test for flow-mediated vasodilation (FMD) to differentiate endothelium-dependent from endothelium-independent response when evaluating endothelial function in humans. Recently, nitroglycerine-induced vasodilation has also been reported to be impaired in patients with atherosclerosis.
Nominal Scale. A scale of measurement in which numbers are used simply as names and have no real quantitative value.
Nonparametric Methods. Statistical methods that do not require the estimation of parameters.
Normal Distribution. A theoretical distribution based on frequency of occurrence of chance events.
Normality. The condition of being distributed in the form of the normal curve.
Null Hypothesis. The assumption that the difference between an observed statistic and a proposed parameter is the result of chance.
Observed Frequency. Number of observations actually occurring in a category.
One-Tailed Test. A statistical test in which the critical region lies in one tail of the distribution. https://www.statisticshowto.com/probability-and-statistics/hypothesis-testing/one-tailed-test-or-two/
Operational Definition. A definition that specifies a concrete meaning for a variable. The variable is defined in terms of the operations of the experiment; for example, hunger may be defined as "24 hours of food deprivation."
Ordinal Scale. A rank-ordered scale of measurement in which equal differences between numbers do not represent equal differences between the things measured.
Ordinate. The vertical or Y axis of a graph.
Orthogonal. Independent; uncorrelated.
Parameter. Some numerical characteristic of a population. In statistics, as opposed to its general use in mathematics, a parameter is any measured quantity of a statistical population that summarises or describes an aspect of the population, such as a mean or a standard deviation. If a population exactly follows a known and defined distribution, for example the normal distribution, then a small set of parameters can be measured which completely describes the population, and can be considered to define a probability distribution for the purposes of extracting samples from this population.
A parameter is to a population as a statistic is to a sample; that is to say, a parameter describes the true value calculated from the full population, whereas a statistic is an estimated measurement of the parameter based on a subsample. Thus a "statistical parameter" can be more specifically referred to as a population parameter.[1][2]
Parameter Estimation. Estimating one particular point to be the parameter of a population.
Partial Correlation. Technique that allows the separation or partialing out of the effects of one variable from the correlation of two other variables.
Population. All members of a specified group.
posterior superior impingement(PSI) Posterosuperior impingement, also known as internal impingement, is a relatively uncommon form of shoulder impingement primarily involving the infraspinatus tendon and the posterosuperior glenoid labrum. It occurs when the shoulder is abducted and externally rotated (ABER position). Clinical presentation patients present with posterior shoulder pain and instability. It almost exclusively occurs in athletes who repetitively place their shoulder into extreme abduction and external rotation such as throwers, swimmers, volleyball players and tennis players. Pathology The extreme abduction and external rotation results in repeated impingement of the infraspinatus tendon and the posterior portion of the supraspinatus tendon between the head of the humerus and the posterior superior rim of the glenoid. There is resulting tendon degeneration, reactive humeral head cysts, and glenoid labrum degeneration. https://radiopaedia.org/articles/posterosuperior-impingement-of-the-shoulder?lang=us
power analysis-The a priori power analysis is what is usually done when designing a study. This tells you what sample size is needed to detect some level of effect with inferential statistics (i.e. with p- values). ... It is important to note that study design impacts power calculations and the interpretation of effect sizes.
Proportion. A part of a whole.
P-Value= probability that the significant differences between groups is due to chance alone. The p value is the evidence against a null hypothesis. The smaller the p-value, the stronger the evidence that you should reject the null hypothesis. P values are expressed as decimals although it may be easier to understand what they are if you convert them to a percentage. For example, a p value of 0.0254 is 2.54%. https://www.statisticshowto.com/probability-and-statistics/statistics-definitions/p-value/#:~:text=The%20p%20value%20is%20the,value%20of%200.0254%20is%202.54%25
The p-value (e.g., probability value) of any statistical test represents the probability that the results were obtained by chance alone. It represents the precise chance of getting that result, and it is derived from the value of the computed test statistic. The actual p-value of a statistical test is computed from the data and is not known until the test is completed.
The specific level of the p-value that is defined as “statistically significant” is called the alpha-level (α-level). This value is defined by the researcher before any statistical tests are conducted. Common α-levels used are .10, .05, and .01. An α-level of .10 means that for a result to be significant, it cannot occur more than 10% of the time by chance. Similarly, an α-level of .05 means that the result cannot occur more than 5% of the time by chance, and an α-level of .01 means that it cannot occur more than 1% of the time by chance.
Qualitative Variable. A variable that exists in different kinds; measured on a nominal scale.
Quantitative Variable. A variable that exists in different amounts. .
Quartile Range The IQR (inter quartile range) describes the middle 50% of values when ordered from lowest to highest. To find the interquartile range (IQR), first find the median (middle value) of the lower and upper half of the data. These values are quartile 1 (Q1) and quartile 3 (Q3). The IQR is the difference between Q3 and Q1.
Randomized, blinded trial- Blinded RCTs are commonly used to test the efficacy of medical interventions and may additionally provide information about adverse effects, such as drug reactions. A randomized controlled trial can provide compelling evidence that the study treatment causes an effect on human health.
Radial nerve The radial nerve is located adjacent to the cubital fossa, anterior to the elbow and deep to the brachioradialis muscle. Strictly speaking, it is not considered to be contained within the cubital fossa but it does pass closely through the area under brachialis. The radial nerve typically bifurcates close to the cubital fossa into a superficial and deep branch. The deep branch is solely responsible for motor function and supplies the muscles of the posterior compartment of the forearm. It passes between the supinator muscle heads and its name changes to become the posterior interosseous nerve which passes close to the radial neck and is responsible for motor function only.3 The superficial branch continues deep to the brachioradialis muscle into the forearm and is responsible for sensation only.
Randomized controlled trial (or randomized control trial;[2] RCT) is a type of scientific experiment (e.g. a clinical trial) or intervention study (as opposed to observational study) that aims to reduce certain sources of bias when testing the effectiveness of new treatments; this is accomplished by randomly allocating subjects to two or more groups, treating them differently, and then comparing them with respect to a measured response. One group—the experimental group—receives the intervention being assessed, while the other—usually called the control group—receives an alternative treatment, such as a placebo or no intervention. The groups are monitored under conditions of the trial design to determine the effectiveness of the experimental intervention, and efficacy is assessed in comparison to the control. [3] There may be more than one treatment group or more than one control group.The trial may be blinded, meaning that information which may influence the participants is withheld until after the experiment is complete. A blind can be imposed on any participant of an experiment, including subjects, researchers, technicians, data analysts, and evaluators. Effective blinding may reduce or eliminate some sources of experimental bias.The randomness in the assignment of subjects to groups reduces selection bias and allocation bias, balancing both known and unknown prognostic factors, in the assignment of treatments.[4] Blinding reduces other forms of experimenter and subject biases.A well-blinded RCT is often considered the gold standard for clinical trials. Blinded RCTs are commonly used to test the efficacy of medical interventions and may additionally provide information about adverse effects, such as drug reactions. A randomized controlled trial can provide compelling evidence that the study treatment causes an effect on human health.[5]The terms "RCT" and "randomized trial" are sometimes used synonymously, but the latter term omits mention of controls and can therefore describe studies that compare multiple treatment groups with each other in the absence of a control group.[6] Similarly, the initialism is sometimes expanded as "randomized clinical trial" or "randomized comparative trial", leading to ambiguity in the scientific literature.[7][8] Not all randomized clinical trials are randomized controlled trials (and some of them could never be, as in cases where controls would be impractical or unethical to institute). The term randomized controlled clinical trial is an alternative term used in clinical research;[9] however, RCTs are also employed in other research areas, including many of the social sciences.Flowchart of Phases of Parallel Randomized Trial - Modified from CONSORT 2010.png - Wikimedia Commons
Random Sample. A subset of a population chosen in such a way that all samples of the specified size have an equal probability of being selected.
Range. The difference between the highest and lowest scores plus I.
Ratio Scale. A scale that has all the characteristics of an interval scale, plus a true zero point.
Raw Score. A score as it is obtained in an experiment.
Rectangular Distribution. A distribution in which all scores have the same frequency.
Regression Coefficients. The values a (point where the regression line intersects the Yaxis) and b (slope of the regression line).
Regression Equation. An equation used to predict particular values of Y for specific values of X. Regression Line. The "line of best fit" that runs through a scatterplot.
Repeated Measures. An experimental design in which more than one dependent-variable measure is taken on each subject.
Sample. A subset of a population.
Sampling Distribution. A theoretical distribution of a statistic based on all possible random samples drawn from the same population; used to determine probabilities.
Sampling Error. The tendency of sample statistics from the same population to vary from one sample to another.
Sarcomere The region of a myofibril between two successive Z discs is a sarcomere (sar´ko-mĕr; “muscle segment”). Averaging 2 μm long, a sarcomere is the smallest contractile unit of a muscle fiber—the functional unit of skeletal muscle. It contains an A band flanked by half an I band at each end. Within each myofibril, the sarcomeres align end to end like boxcars in a train.
Scatter plot. The plot of points that results when a distribution of paired X and Y values are plotted on a graph. '
Scheffe Test. A method of making all possible comparisons after ANOV A.
Simple Effect. The difference between cell means in a factorial ANOV A.
Simple Frequency Distribution. Scores arranged from highest to lowest, with the frequency of each score placed in a column beside the score.
Skewed Distribution. An asymmetrical distribution. The skew may be positive (more low scores than high, so that the frequency polygon is pointed toward the right) or negative (more high scores than low, so that the frequency polygon is pointed toward the left).
Spearman's Rho. A con-elation statistic for two sets of ranked data.
Standard Deviation. The square root of the mean of the squared deviations.
Standard Error. The standard deviation of a sampling distribution. The standard error (SE) of a statistic (usually an estimate of a parameter) is the standard deviation of its sampling distribution or an estimate of that standard deviation. If the statistic is the sample mean, it is called the standard error of the mean (SEM). The sampling distribution of a mean is generated by repeated sampling from the same population and recording of the sample means obtained. This forms a distribution of different means, and this distribution has its own mean and variance. Mathematically, the variance of the sampling distribution obtained is equal to the variance of the population divided by the sample size. This is because as the sample size increases, sample means cluster more closely around the population mean. Therefore, the relationship between the standard error of the mean and the standard deviation is such that, for a given sample size, the standard error of the mean equals the standard deviation divided by the square root of the sample size. In other words, the standard error of the mean is a measure of the dispersion of sample means around the population mean. In regression analysis, the term "standard error" refers either to the square root of the reduced chi-squared statistic, or the standard error for a particular regression coefficient (as used in, say, confidence intervals). Standard error - Wikipedia Standard deviation diagram.svg - Wikimedia Commons
Standard Error of Estimate. The standard deviation of the differences between predicted out comes and actual outcomes.
Standard Error of the Difference The standard deviation of a sampling distribution of differences between means.
Standard Score. A score expressed in standard-deviation units.
Statistic. Some numerical characteristic of a sample.
Stratified Sample. A sample drawn in such a: way that it reflects exactly a known characteristic of the population.
Subacromial impingement syndrome(SAIS-refers to the inflammation and irritation of the rotator cuff tendons as they pass through the subacromial space, resulting in pain, weakness, and reduced range of motion within the shoulder.
SAIS encompasses a range of pathology including rotator cuff tendinosis, subacromial bursitis, and calcific tendinitis. All these conditions result in an attrition between the coracoacromial arch and the supraspinatus tendon or subacromial bursa.
It occurs most commonly in patients under 25 years, typically in active individuals or in manual professions, and accounts for around 60% of all shoulder pain presentations, making it the most common pathology of the shoulder. https://teachmesurgery.com/orthopaedic/shoulder/subacromial-impingement-syndrome/
Subsample. A subset of a sample.
Sum of Squares. The sum of the squared deviations from the mean; the numerator of the formula for the standard deviation.
t Distribution. Theoretical distribution used to determine significance of experimental results based on small samples. .
t Test. Significance test that uses the t distribution.
Theoretical Distribution. Arrangement of hypothesized scores based on mathematical formulas and logic.
Theoretical Frequency. Number of observations expected in a category if the null hypothesis I is true; expected frequency.
Treatment. A level of an independent variable.
Two- Tailed Test of Significance. Any statistical test in which the critical region is divided into the two tails of the distribution. A two tailed test tells you that you’re finding the area in the middle of a distribution. In other words, your rejection region (the place where you would reject the null hypothesis) is in both tails. For example, let’s say you were running a z test with an alpha level of 5% (0.05). In a one tailed test, the entire 5% would be in a single tail. But with a two tailed test, that 5% is split between the two tails, giving you 2.5% (0.025) in each tail. https://www.statisticshowto.com/two-tailed-test/
Type I Error. Rejection of the null hypothesis when it is true.
Type II Error. Retention of the null hypothesis when it is false.
Upper Limit. The top of the range of values a score from a quantitative variable can take; for example, the number 5 has 5.5 as its upper limit.
U Value. Statistic used in the Mann-Whitney U test.
Variability. Differences among scores in a distribution.
Variable. Something that exists in more than one amount or in more than one form.
Variance. The square of the standard deviation.
Wilcoxon and Wilcox Multiple Comparisons. A nonparametric method for independent samples in which all possible pairs of treatments are compared.
Wilcoxon Rank-Sum Test. A nonparametric test for testing the difference between two independent samples.
Wilcoxon Matched-Pairs Signed-Ranks Test. between two correlated samples.
Yates' Correction. A correction for a 2 x 2 chi square when expected frequencies are few.
z Score. A score expressed in standard-deviation units; used to compare the relative standing of scores in two different distributions.
Z line streaming- is observed in muscle damage, as you said, but it's a specific type of muscle damage, damage which originates from the Z-line. The word streaming is used to describe the way by which the Z-lines drift away, slowly degenerating the structure.
Z-line streaming Muscle Damage- High force eccentric muscle contractions can result in delayed onset muscle soreness (DOMS), prolonged loss of muscle strength, decreased range of motion, muscle swelling and an increase of muscle proteins in the blood. At the ultrastructural level Z-line streaming and myofibrillar disruptions have been taken as evidence for muscle damage.