November
06 Research Article-Massage and Exercise Combined-Easy Reading Version
By
Ted Nissen M.A. M.T.
Copyright © January 2007 Ted Nissen
SUMMARY
This
was a first of a kind study with lots of people in it to measure the effects of
massage therapy and exercise combined to help people with chronic low back
pain. The combination of exercise and massage was compared to exercise alone
and massage alone and with no treatment. It turns out in the long run (One
month follow-up) massage alone was about as good as massage and exercise.
Massage alone was about as good as exercise alone but massage/exercise was
better by some measures (function & Pain Intensity) than exercise alone.
All three modalities (Massage/Exercise, Massage, and exercise) were better than
no treatment. That at least tells the statistical story.
Consumers
would be advised to pick the treatment based on time and cost. The least time
consuming option for clients would be soft tissue treatment and the least
expensive would be exercise/postural correction. The comprehensive massage
therapy may provide better pain relief/functional improvements but is both more
expensive and time consuming than the other alternatives. Potential bias, questionable statistics,
uncertain ethical standards/fraudulent practices, high drop out rate at
follow-up makes for the somewhat superior massage/exercise results uncertain.
Future studies should be carefully crafted to address these deficiencies.
Massage
research studies should insure that those who pick people for the study
(screener) and those who assign people to the groups are not the same person
and or that steps are taken and detailed in the study to prevent foreknowledge
of who will be assigned to which groups. Creative solutions should also be
found to make it difficult or impossible for therapists/subjects (clients) to
know who is giving/getting the measured treatment.
Statistics
should be performed and the details included in the study on all participants
even if these subjects dropped out before the completion of the research. Back
up therapists should be available to provide treatment if primary therapists
are unavailable. In no case should the researcher have direct contact or
provide treatment to the subjects.
The
researcher should insure that the research findings in the abstract summary are
consistent with the measured variables and with the findings within the body of
the research study. Researchers should avoid the appearance of “plugging”
research institutions which provided funding for the project by providing
“bogus” research findings just because it may gratify the funding institution.
This erodes confidence in all of the other research findings and ultimately
results in more costly and therefore fewer massage research studies.
Researchers
should defend their research but readily admit when mistakes are made.
Misleading arguments (spin=misleading interpretation
of material facts and or introduction of irrelevant information to argue in
support of false conclusions and or heavily biased characterizations) should not be used to
deliberately deceive research evaluators and avoid responsibility for errors.
The aforementioned practice further erodes the confidence in research findings.
All
of the above difficulties were noted in this study (Summary
of Difficulties)(Conclusion). In short, it may be
that the results reported in this study cannot be trusted. Further independent
investigation of the potential of a culture of deception in scientific
community, at least those entities surrounding this study, could be conducted.
This would include University Oversight of doctoral candidates, peer
review/editorial process at the Journals, and Review of the College of Massage
Therapists oversight practices. Perhaps this could be handled by an Ombudsman
at these various organizations to determine if research fraud is evident in
this study.
For
a more detailed summary recap of this study click the following link (Recap)
RESOURCES
The following resources may be useful to open and keep open
in a separate window while you are reading the text as a reference. These links
are repeated in the section where they are most useful, if you haven’t already
opened them.
Research
Article= http://www.cmaj.ca/cgi/reprint/162/13/1815
Questions
to Author= Questions to Author
Definitions
of Technical Terms= Definitions
Baseline
Client Characteristics= Baseline Measures 1
Baseline
Pre Treatment Scores= Baseline Measures 2
Outcome
Post Treatment and Follow-up Scores= Outcome Measures
Statistical
Results from Research Study= Outcome Measures Results
(Read the notes section for instructions)
Matriculation
(How many people completed the study)= Matriculation
Research
Conclusions Abstract Summary= Abstract-RDQ-PPI-PRI-Inaccurate
Info
Research
Conclusions Body of Paper=
1.) Body of
Research Paper-RDQ-Follow-up-No Statistical Differences
2.) Body of
Research Paper-PPI-Post Treatment-Statistical Differences
3.) Body of
Research Paper-PPI-Follow up-No Statistical Differences
Comments
by Readers of this Analysis= http://www.anatomyfacts.com/Research/november06simplecom.htm
INTRODUCTION
The
Story of the November Research Study (This is a bit long because the advantage
of technical terms is that one word can
be used to represent a whole mess of other words-it is much like short hand)
This
article does not contain a bibliography or endnotes to facilitate ease of
reading. Endnotes would be numbered to reference sentences or passages. This is
done in scholarly papers to show supporting evidence for the information
contained in your writing. For your information, the endnotes for this paper
can be viewed with the following link. (Endnotes) As you
will notice, there are 79 endnotes in the analysis of this research paper.
Because endnotes tend to repeat and are not alphabetized bibliographies are
created as an alphabetical listing of the references. This makes it easier to
find a reference rather than looking for the reference in the un-alphabetized
endnotes which are ordered by where they were referred in the text. Also not
all endnotes include all the references, as does the bibliography. You can view
the bibliography with this link. (Bibliography) You
will notice there are 57 references cited in the bibliography.
ANALYSIS
The
November research article was published in one of Canada’s leading medical
journals in June of 2000 but the preparation for the research study began well
before that. It took 8 months to gather the clients for the study, 1 month to
conduct the research, and about 10 months to write the research paper and get
it published. This research project studies whether of not combining
exercise/posture with massage is better than exercise/posture alone or massage
alone and whether any of these modalities is better than no treatment at all.
There are some interesting surprises to this study and nothing may be, as it
seems. Here is the story of that research project.
Between
November 1998 and July 1999 the author of the November research study, Michèle
Preyde began soliciting subjects for this study. At the time of the study Michèle
was a graduate student working on her PhD in Social Work and was also a
registered massage therapist with the Canadian College of Massage Therapists.
The College of Massage Therapists is a government institution that registers
MTs in Canada and has funded this research project for $38,000. During this
initial period during 1998-99 Michèle sent out E-Mails to the local college
faculty, advertised in the paper, sent out flyers to local doctors that she
needed volunteers for a research study on low back pain. 165 people responded
to the ad 107 (65%) were selected for the study (Matriculation).
About 91 ended up completing the study. It is not clear whether she intended to
pay these folks but often research subjects are paid for their time and gas
mileage. In the ad the number of a screener was provided and interested
subjects (clients) called the number. The screeners role was to determine
whether the prospective subject qualified for the study based on the following
criterion. 1.) Existence of subacute low-back pain (back pain of 1 week-8
months duration) 2.) Absence of significant pathology (bone fracture, nerve
damage or severe psychiatric condition (clinical depression as physician
diagnosed) 3.) No pregnancy 4.) Stable
health 5.) Previous episode of low-back pain ok 6.) Positive radiographic
finding of mild pathology ok.
About
104 people were recruited (3 dropped out before group assignment). After the
research was published, there was some criticism that a physician should have
examined all of the patients because you may not be able to trust people to
self-report of their medical condition. What do you think?
You
can begin to see why research is so expensive. Especially if you have to pay
all of the subjects, the screener ect. That is why big businesses,
institutions, or government funds a lot of research because it’s so expensive
for small clinics or individuals to afford. Turns out most people won't do the
research unless they are paid. Problem is the deep pocket funding source may
have an interest in the outcome. They could put pressure on the researcher to
give them the results they paid for.
SIDE
BAR=One of my friends tells the story that as an assistant to a corporate
executive he was told to "get that ....... researcher on the phone,
because I'm not paying out $50,000 for this junk. Tell them if they ever want
another grant they had better produce something I can quote. This research is
going to make me look like an idiot to the board of directors"
To
be more polite, when you favor a certain outcome that is not supported by the
data its called research bias, because you may have, for example influenced the
subjects to report the result your funding source wants or included a statement
in the research summary which was not supported by the numbers. It’s a tricky
business. This problem may be widespread but the influence of the deep pockets
may be much more subtle. Researchers just know how the game is played and no
one talks about it. There are no smoking gun E-Mails or hard evidence. This is
not talked about because it would be so embarrassing for everyone concerned.
Some of the biasing influences may even be unconscious to the parties
concerned. It’s simply unclear how widespread this problem actually is. A good
research project is designed so that cheating is next to impossible. Research
design flaws usually have to do with loopholes where someone could cheat if
they wanted to even if there is no proof that anyone did. Science does not
trust human nature to do the right and honorable thing. Problem is covering all
of the loop holes may cost more money and take more time than the researcher or
the funding source would allow. This makes it all the more important that the
researcher goes out of their way as a model for ethical behavior, so that the
research results can be trusted. That is if a loophole is found in the research
the readers of the research paper are more likely trusting if the researchers
behavior appears ethical in every other aspect of the research project. Because
you can not always verify if a person is cheating by taking advantage of a loop
hole this trust issue is very important. It is the basis for the trust of
scientific conclusions. In this study as you will see the researcher evaded taking
responsibility for errors and denied inconvenient truth.
Anyway back to our discussion. Now we have about a hundred
people ready for their free massage. They may even be waiting for a little
extra cash for their time. It is often asked "Doesn't this bias the
research." Perhaps but it’s the only way to get subjects nowadays. It is
not clear in the research how an assignment person is chosen for this task. Is
this person paid and do they have any connection to the researcher? You can see
a possible loophole if the assignment person knew the researcher they could
influence the outcome. However the assignment person was chosen they are given
the task of putting these folks into four groups. This is done randomly with
the use of a random numbers table. The research paper does not tell us exactly
how that was done. We will describe here the usual procedure. If you want a
more detailed description of this procedure click this (Link)
The first step is to assign each person a number for the
hundred or so study participants. Each group then has approximately 25 people.
You could choose to fill each group and then move on to the next or fill the first
slot in group 1, then 2 thru 4 and then back to group 1. A consistent method is
what is required. The random numbers table is a table of 5 digit numbers for
example with column and row headings. Take a finger and pick a starting number,
decide on the first part of the five-digit number and start assigning people to
groups based on these numbers, as they were pre assigned to people. This is
called randomization because in theory you could not have predicted who was
assigned to which group, thus the term random assignment.
There is a fly in the
ointment of this particular study. It is not clear in this study if the
screener and assignment person were the same person or independent of one
another. This is because if the screener was the assignment person they could
pick and choose who was going to be in the study and even though this is
supposedly a random study this person could cheat and put people in the groups
they wanted. They could select people based on their own prejudgment or bias.
This is called selection bias when the assignment person knows who the people
were who were assigned the numbers. This is a loophole that could result in
selecting less severe people for the therapies you want to do better and more
severe people for the therapies you want to do worse or for that matter
excluding people from the study completely. If you know what group the next
person will be placed in you can alter your selection accordingly.
This is not to say in this study there is any proof of this
kind of cheating but as aforementioned is considered bad form and the study is
therefore considered less valid. People have cheated in other studies and been
caught doing so (We will talk about the statistical ways of catching a cheater
later). When the opportunity is there, it is considered possible. It reverses
the effects of random selection described above because since if you know the
next person selected will be assigned to which group you can control the
process even though a random number was assigned to each person and used in
group selection.
This research study did not tell us enough to
know whether any of these problems were real but in evaluating research, you
should assume the worst when not otherwise indicated. This problem is called no
concealed allocation because the allocation to group assignment was not
concealed. There are several fixes to these problems; 1.) The screener should
be independent of the assignment person, the assignment person should be
independent of the researcher and the envelopes or file container which contain
lists of who is assigned which random number and which numbers are assigned to
which groups should be hidden (opaque envelopes). 2.) Allocation should be done
by a person “off-site” to the research project, and by someone who has no
association to the project personal. 3.) Whatever precautions are taken these
precautions should be clearly outlined in the research paper to document the
absence of selection bias. This paper did not mention any procedures to prevent
selection bias and insure allocation concealment. The author was asked about
this problem, allocation concealment (see questions to author (References)
under question # 8)
The four groups these people were placed in consisted of
three treatment groups and one control group. The control group is set up so
that people think they are receiving a treatment when surprise surprise they
really aren't. In this case it was a laser that was made to look like it worked
but it didn't (fake). That way you are controlling who receives what treatment
and comparing the treatment groups with a group that didn't receive treatment.
Calculating statistics compares these groups.
One of the most important statistics is the mean
(MEAN=Average Score). Figure out what kinds of tests you will do on the clients
add up the scores and divide by the number in the study and you have a
statistic (one number that represents a lot of numbers). This is the very
statistic that is used in baseball to calculate batting averages. If you have
the following numbers; 6, 9, 2, 1, 8; Total these numbers Total=26 and divide
by their number; MEAN= 26/5= 5.2. In this case the mean of these 5 numbers is
5.2. This one statistic is used probably more than any other in research. Here
is why; no matter what you are measuring whether it is a drug treatment or talk
therapy with a psychologist a number that can be added to other numbers is
produced from that research. Usually these numbers are produced before
treatment and after treatment. Various complicated
formulas (WE WON"T GO THERE YET) are used to determine whether the mean
score before treatment was significantly different from the mean score after
treatment or whether the difference is due just to chance (Generally if you
flip a coin you may get more heads for a while but eventually it’s a 50/50
trick-These formulas help you determine whether your results are due to those
chance occurrences-Pretty cool).
You can try flipping a coin yourself. For a long while you
may get more heads, for example. If you were doing research and the heads was
the positive result of your treatment you might think that the treatment was
effective. In fact it might be due to chance fluctuations. That is, Coin flips
normally result in more heads for awhile and then more tails, but these are
just chance occurrences which with enough coin flips perhaps 10,000, the number
of heads and tails would even out to 50% heads and 50% tails. In research the
same is true. You don’t want to have to take 10,000 ranges of motion measurements
for example just to find out whether your result is due to chance or are
because of the treatment you provided. The formulas figure out for you the
probability that your differences between the means before treatment and after
treatment, for example, are due to chance.
If the probability is 1 chance in a 1000 then you are pretty
safe to assume that the differences you observe between the groups is due to
the treatment you provided and not due to chance alone. If your formulas tell
you that there is a 50 in 100 chance that your results are due to chance you
probably can’t count on your treatment’s effectives. When you see p= or
P-Value= that is the probability that your results are due to chance. That is
that the probability that the significant difference between groups is due to
chance alone.
Most research studies will have charts of numbers and in the
right hand side of the chart will be that p or p value. If this value is under
.05, which means 5 chances in 100 that your results are due to chance alone,
then you can be fairly certain that your treatment was effective. Outcome
Measures To put it another way, if significant differences between
the groups have been found the P-Value tells what the probability is that these
differences are due to chance alone.
If the difference wasn't due to chance your treatment is
considered effective. When you have more than one group the formulas get a lot
more complicated (ANOVA-Factor Analysis)(Don't even ask). These formulas help
you determine whether the differences between the groups before, sometimes
during, and after treatment are significant or just due to chance.
As I've said there are four groups to this study. There were
approximately 25 people in each group give or take. The first group is the
comprehensive massage group. This group received massage as well as exercise
and postural correction. The soft tissue massage involved asking a subject
where they hurt. Massage therapists performed the following soft tissue
techniques on subjects. 1.) Friction (Used for Fibrous Tissue) 2.) Trigger points (Muscle Spasm) 3.) Neuromuscular therapy where no particular use
was specified in the study. The soft tissue massage treatments lasted about
30-35 minutes.
SIDEBAR-The author’s view of Comprehensive Massage therapy (skip)
The author states that comprehensive massage technique and
benefits of said technique as described in this study “are not generalizable to
other form(s) of therapies that one might consider similar.” Since this
research study does not provide enough information to evaluate whether this is
a correct characterization, the author was asked for further supporting
documentation (see questions to author (References)
under question # 2).
Unfortunately the author does not
have these documents readily available and so this claim by the author can’t be
assessed. The author seems to want to make the case that comprehensive massage
as practiced by experienced therapists with additional training is what makes
this combination of exercise/soft tissue massage more effective. If you
carefully read the analysis under question # 2 you may be tempted to
characterize the authors above answer, as an attempt to spin
a clever plug for the funding source the “College of Massage Therapists”
without mentioning their name and further without doing the research to prove
the claim since education and experience were not measured variables (a
variable is the thing that is measured=pain rating, function, ROM ect) in this
research study.
There is the additional fact that
the exercise portion of the comprehensive massage was provided, in part, by a certified personal
trainer/weight-trainer supervisor and not a massage therapist. The experience
or education (did they graduate from a college of massage therapist approved
school? Probably not.) of the personal trainer was not made clear in the
research and so can not be considered as a factor that gives clear advantage
and or makes dissimilar the comprehensive massage technique.
This may be an example of spin on the part of the researcher
because it is a distortion of the material facts. It treats comprehensive
massage as if it were just one technique provided by a massage therapist
instead of two techniques provided at least in part by a massage therapist and
a personal trainer each with possibly different educational backgrounds and
experience. This supports the false conclusion that comprehensive massage is
better due to education and experience of one massage therapist. The spin of
the researcher also introduces irrelevant information (education & training)
which distracts attention away from the
important measured variable which is client function, pain levels, and lumbar
ROM at pre treatment, post treatment, and at 1 month follow-up after 4 distinct
therapeutic or sham therapeutic interventions.
OTHER RESEACH GROUPS (BACK TO THE RESEARCH)
The soft tissue massage group consisted of only soft tissue
massage and no other modality.
The exercise group consisted of stretching exercises for the trunk,
hips and thighs, including flexion and modified extension, Stretches were to be
performed in a relaxed manner within the pain free range held for 30 seconds,
Subjects were instructed to perform stretches twice one time per day for
related areas and more frequently for affected areas. Subjects encouraged to
engage in strengthening or mobility exercises such as walking, swimming or
aerobics and to build overall fitness progressively. Postural education
consisted of proper body mechanics instruction, particularly as they related to
work and daily activities.
So to recap; Comprehensive massage included basically all of
the modalities. Soft tissue, exercise/postural ed with daily home exercise such
as walking encouraged but not mandated. The other two groups separated out
these modalities. For example Group 2 consisted of soft tissue only and group 3
was exercise/postural only. The fourth group was the laser treatment that
really didn’t work.
You can skip
the following if you are not interested in the details of who provided the
treatment, how much they worked and how much they were paid. Scroll down until
you get to the summary for a brief review or click the skip link. This study is a bit
complicated from a staffing viewpoint, as you will see. For simplicity I’ve
rounded the numbers.
Two massage therapists were hired to provide the soft tissue
treatments and paid $40 for each 30-35 minute session for 6 sessions. Each
massage therapist then handled approximately 25 clients for 6 visits each or
150 visits over about a month’s period (37.5/clients/week or about 18.75-21.88
hours/week) to the tune of $6000. This
works out to a total of 75-87.5 patient hours in a month. At that rate the
massage therapists were paid between $68.57-$80 per hour.
In addition one massage therapist also saw about 12 sham
laser patients for 6 visits with a total of 72 visits at about 20 minutes for
each session and made $15 per session or $1080 or about 24 hours of sham treatment
in a month. This works out to about $45 per hour for sham laser treatment.
One massage therapist then worked upwards to 27.88 hours per
week or for a total of upwards of 111.5 hours total making about $7080 for
their combined services providing both soft tissue massage and sham laser
treatments. This averages out to about $63.50 per hour for the combined
treatment.
The other massage therapist received just $6000 for a month
of soft tissue massage as aforementioned but then received additional monies
for remedial exercise of $2250 totaling $8250. This massage therapist worked
upwards to 34.38 hours per week of upwards to 137.5 hours in a month. This
works out to about $60 per hour for the combined treatment.
One certified personal trainer/weight-trainer supervisor (I
assume this is just one person) was hired to provide sham laser treatment for
13 patients (I guessing they gave the extra client to the lone trainer). The 13
sham laser patients were seen for 6 visits of 20 minutes per session for a total
of 78 visits for a total of 26 hours for the month or 6.5 hours per week,
receiving $15 per session for a total of $ 1170.
One certified personal trainer/weight-trainer supervisor
worked upwards of 19 hours per week, 76 hours total for a total of $ 3420 for
combined exercise and sham laser treatments making a total of $ 45 per hour of
combined treatment.
One personal trainer/weight-trainer supervisor and one
massage therapist was hired to provide “remedial exercise” for 25 patients
each, which I assume included postural education although the study does not
specify. In addition the study does not tell us which of the massage therapists
provided the remedial exercise and so I will assume that it was the one who
didn’t provide sham laser treatments. Each session was 15-20 minutes long and
the therapists were paid $15 per session for 6 sessions totaling $90 per
patient. There were 50 patients who received “remedial exercise” and the
trainer/massage therapists were paid a total of $4500 or $2250 each for their
services. There were a total of 300 visits or 150 visits per trainer and a
total of 75-100 hours or 37.5-50 hours of training per trainer per month. This
works out to about 9.38-12.5 additional hours per week at a rate of $45-$60 per
hour.
The one objective measure, the range of motion test, was
conducted by 3 physiotherapists who were blind to which group each subject was
allocated. The study does not tell us, however, how much the physical
therapists were paid or how much time they spent completing their tasks.
FINACIAL
SUMMARY-
Soft Tissue Massage=50 patients 300 visits=$12000 Exercise/Posture=50 patients
300 visits=$4500 Sham laser Treatment=25 patients 150 visits=$2250 Total=$18750
for all of the treatments provided in this research project. Massage Therapists
received an average bulk payment of $ 7665 for their combined treatments
working an average of 124.5 hours in a month at an average of $61.57 per hour
of work with an average workweek of 31 patient hours for 4 weeks. The trainer worked
upwards of 19 hours per week, 76 hours total for a total of $ 3420 for combined
exercise and sham laser treatments making a total of $ 45 per hour of combined
treatment.
A significant amount of money was paid to the massage
therapists and the trainer who provided the treatments in this study. Care
should be taken in any study to avoid competing interests of the treatment
providers and researcher, which could affect the outcome of the study. That is,
if the treatment providers/researcher have an investment in the outcome of the
study they could affect the subjects response positive or negative to the
treatments. If in other words there is some benefit or financial reward to the
treatment providers for a positive study outcome then the therapists may even
unconsciously bias the research.
A special relationship of touch and nurturing which may
return many to their childhood where a trusted parent’s suggestions had
amplified potency. Subjects in this study were rating their own functioning and
pain. The influence of the therapist might be quite significant since the
measure of progress is subjective. We cannot place a ruler inside a person’s
brain to measure their pain. If we could that would be an objective measure
because we could all examine the object measured and the ruler used to measure
it. That way if errors have been made these errors would be apparent to the
group and could be corrected. In the case of objective measurement, although
the personal interest of the therapist could affect how they measured an object
it is less likely a problem for example when measuring range of motion. With
subjective measures, there is no way to check the measurements because the
object of measurement is not visible. In the case of this study the researcher
or therapist had to ask the subjects about their functioning and pain.
Subject’s responses may be affected by their personal affection for a nurturing
therapist who has expressed their own interest in positive outcomes. The
therapist can in many subtle or perhaps not so subtle ways influence the
subject’s assessment of their functioning and or pain. Some people are more
suggestible than others. We simply can not know for sure whether or not a
therapist is influencing subjects self ratings and so precautions which blind
therapists to whether or not they are providing therapy help eliminate some of
the economically or other incentivized bias which may influence the outcome of
the study. It might also be helpful to blind the subjects so that they wouldn’t
know whether they are in the treatment group being studied. There are clever
and creative ways of doing this that don’t necessarily cost a lot of money. In
this study none of these blinding techniques were utilized. This is the meaning
of double blinding in research. Neither the therapist nor the subject knows
which of the groups contain the treatment being measured. If you also blind the
screener as aforementioned that is a triple blinded study.
Care should also be taken to select therapists who have no
connection to the researcher to avoid bias resulting from friendship, business
or other relationship. The researcher claims the following with regards to
provider selection
“At the time of the study, the study site was new and still in the process of becoming fully developed. The coordinator of the Centre had recently interviewed several people for the Centre, and this coordinator assisted with locating appropriate personnel for the study.”
One of the massage therapists in the study had a family
emergency and could no longer provide treatment to the subjects. The researcher
herself took over the treatment to the subjects. The researcher herself denies
receiving any financial benefit for her work on subjects which she claims was
minimal (1-2% of time). Although the researcher minimizes her contact with
patients and denies financial reward she might have been incentivized to bias
in other ways. The funding source was the College of Massage Therapists of
which she was a member as a registered massage therapist. The benefits may
include increased prestige of an organization to which she belongs and well as
future funding grants for positive study outcomes. Since this was a doctoral,
dissertation additional benefits may accrue from a research project with
positive outcomes. It would probably have been wiser in retrospect to have back
up massage therapists who could have provided treatment in case of emergencies
like this.
This is also a peer-reviewed study, which simply means that
this study was reviewed by experts in the field of massage therapy/exercise
ect. These peer reviewers or referees are individuals who are widely recognized
by the profession and or public as having special expertise in the field of
massage therapy research. In this study, we are not told who these experts are
which is normally not revealed in most studies. Perhaps we should be told.
In this case, the editor of the Canadian Medical Journal
(CMAJ=Canadian Medical Association Journal), which published this research,
would have chosen a person/persons to peer review this article but ultimately
the decision to publish would be with the editor. The peer review process aims
to make authors meet the standards of their discipline and of science in
general. Articles which do not pass the peer review process are less likely to
be accepted for publication. Again, it is up to the editor as to whether the
article is actually published. Even peer reviewed (refereed) journals, however,
have been shown to contain errors, fraud and other flaws that undermine their claims
to publish sound science. So far, in the case of this article, we have found
several questionable practices, which warrant further investigation. Why was
this study accepted by such a well-respected Canadian Medical Journal? Is it
normal accepted practice for example for the researcher to provide actual
treatment to patients, falsely list research results in the abstract summary
that are not supported by the data in the body of the research paper, and plug
the institution that funded the research without scientific cause? Was this a
mistake in the peer review process? These and other questions may go
unanswered.
So far, we have covered all of the essential elements of a
research project except one important aspect. How will we measure whether or
not our treatments are effective? As aforementioned, this study uses
self-rating and objective measures. First let’s discuss the self-rated
measures. We’ve discussed that; you can’t put a ruler into someone’s head and
rate pain. These self-rated measures are subjective, that is hidden within the
person who must relate their personal inner experience. This makes it difficult
to know whether measurements are accurate since we have to rely on estimation
and can’t verify.
However, in the field of psychology, for example, it would be
impossible to do experiments unless these measures were treated as if they were
objective. That is, we pretend that we can take a ruler and put it in your
brain to measure pain for example. To do this, much research is done which
establishes whether these self-rated measures predict a person’s objective
function. For example, research shows that IQ can predict academic success in
school even though IQ scores do not technically have equal intervals between
each number. What are these scales of measurement anyway? This gets a bit
technical but it is important to understand so hang with this if you can. Click this link (it will open a separate page
so you can easily refer back) and please read carefully. (Scales)
Scales like IQ and self-rating scales similar to the one used
in this experiment are not technically supposed to produce statistics (a number
that summarizes many other numbers) because the intervals between the numbers
are not equal. Add two numbers together, for example, 2+3=5. When the
difference between 1 & 2 is not the same as the difference between 2 &
3 you could not say for example that two equal measures plus 3 equal measures
when summed together equals 5 equal measures since the difference between each
number is not equal. Nor could you say where 2+2=4 that 4 was twice as many as
2 since the intervals between these numbers is not the same. If you added
numbers with unequal intervals between them together to produce a statistic
like the mean (add the numbers together and divide by their number=mean) you
could not compare the means from two groups if the measures between the numbers
were unequal for both groups. A mean of 3 in group 1, for example, would not be
the same as a mean of 3 in group 2 if the measures between the numbers in each
group were different. This makes it technically impossible to compute
statistics within and between groups.
Why are the differences between the numbers unequal? This is
because as aforementioned we are assigning number values, which only indicate,
greater of lesser value assignments (ordinal= ordered sequence). This is
because we do not have a way to precisely measure, as previously mentioned, the
difference between some things except to say that they are of a lesser or
greater value. The first place winner in a race is not of equal measure better
than the second place winner nor is the 3rd place winner 3xs slower
than the first place winner. These ordinal (ordered) scales measure something
that is not easily pinned down yet it is a convenient way to declare the winner
of a race.
Similarly, we cannot measure the pain or anxiety a person experiences
but we can say that there is more or less of this quality of pain or anxiety.
This is a convenient way of ordering the greater or lesser intensity of
subjective experience. Unequal differences occur in self-rating scales because
clients will rate pain differently. Different clients, for example, may have a
different idea of what 5 on a pain scale of 0-10 is or what the difference
between 5 and 6 and 6 and 7 is. Even the same person may mean something
different if their pain rating on one day is 5 and on the next day is 6. Since
we cannot use a ruler, which does have, equal intervals that we can all agree
upon we have to rely on self-reported measures of pain on a scale which we can
not see. This scale has intervals between the numbers that may be different in
each person.
Finally, this scale could change from day to day or even hour
to hour. Yet as, aforementioned, many disciplines in political, social,
psychological, and psychiatric professions rely on these scales or similar
scales to advance their scientific research. This is because these scales are
useful in measuring progress. As mentioned, much research has been done to
establish whether these scales are valid. For example, do these self-rating
scales actually predict improvement or lack of improvement in objective
functional assessment? There is research
to show that, for example, increased pain rating correlates with decreased
objective measures of range of motion. It then may be possible take a self-rated
pain rating and predict an objective measurement. This makes using these scales
useful in evaluating the effectiveness of treatment.
The numbers from these self-rated scales, even though they
are subjective measures, are treated statistically as if they were objective
measures. This is only true though if care is taken not to influence clients.
It is also well researched that provider influences result in
sometimes-dramatic differences in the way people rate their pain for example.
If the therapist wants a certain outcome and transmits that to clients even
subtly, self-rating scores can be affected both positively and negatively. We
are all, to varying degrees, susceptible to suggestion. With self-rated
measures, it would be impossible to tell whether suggestion had influenced
clients self-rated measures, since we cannot examine the ruler or the object
because it is within the subject/client. This study as we have detailed did not
take reasonable precautions to insure that clients were not influenced by
researcher bias, given that the researcher herself provided treatment and
therapists were not blinded. As will be discussed the objective measures in
this study were not statistically different between the groups. This in itself
may be a statistical sign of problems. If self-rated measures in this study
show improvement (which they did) then the objective measures should also
(which they didn’t). It could be argued that researcher bias was responsible
for an over inflated level of improvement. It could also be argued that the
objective lumbar range of motion measures were within the normal range pre
treatment which might explain the lack of objective improvement. The research
paper does not tell us whether patient ROM was within the normal range pre
treatment. The schober measure has a norm of about 7 cm (SD 1.2) so just
eyeballing the pre treatment data they all look to be a little low in the 5 cm
range. This would mean we would expect some improvement in the objective
measure which we didn’t see.
The following sidebars discuss the topics of blinding
therapists and a detailed explanation of spin. If you wish to skip to the main
topic of self rating scales click the following (scales).
SIDEBAR BLINDING THERAPISTS AND SUBJECTS
The researcher claims (see questions to author (References)
under question # 8) the following;
“It would be difficult if not impossible to blind subjects and therapists…”
It is difficult to blind subjects and therapists but probably
not impossible. Difficulty does not exempt researchers from the attempt. The
scientific community would not exempt this researcher from this research design
criterion because it is difficult and because good scientific research depends
on it. After all in this particular study the author (who has full knowledge of
treatment variables) actually made contact and provided treatment to research
subjects. It would not have been difficult to have back up therapists provide
treatment yet she provided direct treatment to subjects. The blanket claim that
blinding is too difficult to do is not entirely valid. For example steps could
be taken and documented in the study, which although far perfect would decrease
therapist and subject awareness of whether they were in a treatment group. Essentially
you could spin (most of us would probably approve of this kind of spin even
though it is a lie) the research project to selected subjects and therapists.
This would be a kind of “white lie spin” that doesn’t hurt anyone and helps our
profession by reducing the impact that therapists and subjects may have in
biasing research.
For example you could develop a background story to share
completely or in part with therapist/subjects. The purpose of this story is to
make it difficult to know which measures are being evaluated and in what way.
You could tell subjects and therapists that this study was about the affects of
several treatment methods, low back pain, and personality types. The research
question was whether pain perception and functionality are influenced by
inappropriate therapeutic interventions for the personality type of the person.
Certain personality types for example may not respond well to exercise and how
would the application of exercise affect their low back function and pain
perception. This would explain all of the material facts of this particular
study eg. They will receive some type of treatment to some area of their body
and subjects will be asked about personality traits, low back pain, and
function. Given this explanation you could add a sham soft tissue massage
therapy and apply it to another part of the body far removed from the low back.
This could be explained away as yet another inappropriate personality type
therapy and its effect on function and pain. This is all a lie, misleading both
therapists and subjects about the true nature of the research.
These are just free association brainstorming ideas and may
not be practical but do serve an example of creative research design which may
be necessary in at least attempting to blind both subjects and therapists with
therapies that require personal touch and are difficult to masquerade.
SIDEBAR END
SIDEBAR (BEGIN) DEFINITION OF SPIN
Most people hear the word spin and just assume it’s a lie.
Perhaps spin is just a fancy way of saying that someone is lying. After all if
we define lying as; to make an untrue statement with intent to deceive there is
a close association between lying and spin. Spin is probably the more complex
and nuanced version of lying including some facts and half truths and perhaps
many little and big lies.
We can all claim some ready awareness of the difficulty of
relating our experience accurately. It is apparent that we can not completely
represent our world of infinitely complex experience with words or otherwise.
Our experience is simply to complex for our brains to capture and beyond our
verbal/writing skills to fully articulate. We selectively remember certain
events and forget others usually with characterizations which favor the image
we have of ourselves and or how we want to be perceived by others. The events
we remember represent our interpretation of reality and not reality itself. Our
recollections are a collection of self selected memories which is in part
distortion, in part real, and in part forgotten/denied.
This becomes clear when friends or spouses see the same movie
and realize their versions afterwards are some times so radically different
that it is unclear to both that they even saw the same movie. The telephone game
is another example of how selective perception alters the original experience.
The telephone game works like this; you form a circle with several people and
whisper a story around the circle. The story is written down in its original
version. The first person whispers the story by reading it into the ear of the
person to their left, for example. The next person just repeats the story they
heard into the ear of the person to their left without the aide of a written
version. After several repetitions this story is almost never the same as the
original. Is everyone lying? Probably not but the concept of spin probably
better describes what folks are doing.
The point is that all of us selectively choose from our
infinitely complex experience certain material facts, which may also be
distortions or even outright fantasies. This type of spin is largely
unconscious and probably lacks internal consistency. Given this fact we are
quick to forgive others for misstatements because we assume, as with ourselves,
there was no conscious intent. We forgive others the little lies and
exaggerations as long as there was no conscious intent or if there was it was
not malicious (white lie). It is very difficult to prove conscious intent and
so we give others the benefit of the doubt. One sign of conscious intent is a
consistent pattern of deception in service of some false conclusion. The
stronger the pattern of deception the more chance that the individual was
conscious of their deception and therefore lying.
Professional political Spin (Spin Doctors) is much more
conscious and consistent to a political strategy. Spin in research has probably
not been studied enough but from this research study seems to be evident. How
much conscious intent exists is hard to discern but some of the elements of
professional spin seem to exist. You could envision though that as businesses
and or institutions need research to support their various activities where
accuracy is not crucial and spin could be used to cast a favorable impression
without the extra cost of further research. Obviously businesses want consumer
surveys to be accurate so that the product sells by incorporating improvements
made by consumer input.
Institutions though may be looking to increase their
credibility with the public may not need research to be so accurate. If they
have developed relationships with Universities, in particular university
professors, over time the funding source makes its intent known and researchers
who are comfortable with spinning the research results are recruited.
The definition of spin again is; selecting true facts (cherry
picking) which support a false conclusion, presenting inaccurate information,
misleading information, misleading interpretation and or denial of material
facts that do not support false or misleading assertions, denial of
indefensible assertions, Rejecting valid criticism as flawed and or even
attacking the personal reputation of the critic, outright lying and or
introduction of irrelevant information to argue in support of false conclusions
and or heavily
biased characterizations. If there is a pattern of deception as indicated by
the aforementioned elements conscious intent can be deduced. We can then assume
that the person was not telling the truth with conscious intent to deceive
(lying).
Several elements are used to make the spin work against
objections from others and or close examination. The following is a brief
discussion of some of the spin tactics and their particular application in this
research study. You will probably need to open the following charts in (References);
Baseline Measures 2, Outcome Measures, and Outcome Measures Results. Before
reading the following make sure you are well rested, in a good mood, and ready for
some serious mental concentration. This is made complicated and at times
tedious because the author has demonstrated some intricate and sophisticated
logic and wording. It also includes some statistical concepts you may not be
familiar with. Hang on to your seat it is going to be a bumpy ride. If you get
to frustrated just read past the material until you finish the whole paper.
Many things maybe reinforced and or explained differently. Then re-read these
passages as they may make more sense. You can always post a question to the
group for clarification. To skip this passage partially (skip
partially) and skip to the summary. To skip this passage completely
for now click the following; (skip)
1.)
Presenting Misleading Information, Inaccurate Conclusions,
and or Using Factual Information to Deceive (Cherry Picking)-
This is going to take carful concentration on your part. It is going to be hard
to follow because it is complex and the author has couched her findings in
clever and yet misleading wording. The research papers abstract summary
incorrectly implies significant differences between comprehensive and soft
groups on certain measures (RDQ). There are other incorrect conclusions in the
summary between the Comprehensive and other groups but we will start with the
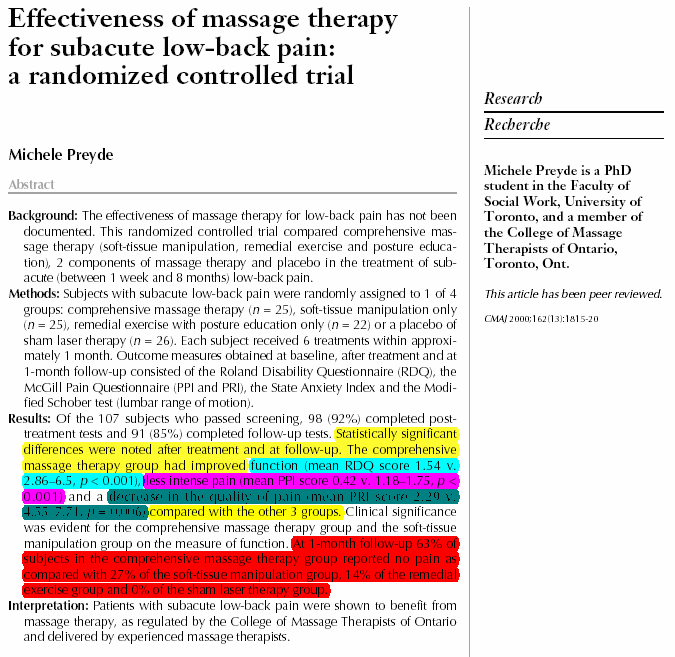
RDQ measure of function. The incorrect conclusion is quoted as follows;
"Statistically significant differences were noted after treatment and at
follow-up. The comprehensive massage therapy group had improved function
(RDQ)...compared with the other 3 groups (this includes the soft group #
2)." For your convenience click the following link to view the yellow
highlighted abstract summary as previously quoted. (Abstract-RDQ-PPI-PRI-Inaccurate
Info) The yellow highlighted phrase, although carefully worded, implies statistically significant differences
after treatment and at follow-up although it does not say that directly. In one
sentence it mentions statistically significant differences and in another it
says improvements. Although an improvement may be evident it may not be due to
anything other than a chance fluctuation (probability).
If there is only improvement between the comprehensive and soft groups it may
be meaningless unless they are statistically significant. The comprehensive
groups may have improvements over the other groups while these differences were
not statistically different. This is subtle and tricky phrasing. The implication though is clear. This type of
wording might allow the author deniability. More on that later. It would be
easy to assume that the this use of words is accidental (ie the author may have
used the words statistically significant and improvements interchangeably)
except that it fits within larger pattern which looks more like calculated spin
which we will examine. Given the facts you can then decide for yourself is it
spin or something else. We do not have access to the actual statistical
calculation of this study (the author claims no easy access). The author was
contacted and states "I think the important statistically significant
differences were noted in the article." There were no statistically
significant differences between the comprehensive and soft post treatment for
the RDQ measure mentioned in the article and so we can assume that no
significant difference between these groups existed. The abstract summary both
in the yellow highlighted abstract below (Abstract-RDQ-PPI-PRI-Inaccurate
Info) implies that there are
statistically significant differences post treatment between the comprehensive
and soft groups yet no difference were mentioned in the body of the research
paper and thus no statistical difference noted by the author. This contradicts
the author’s implication of statistical difference in the summary. NOTE-Only the follow-up scores are
reported in the abstract summary, which are highlighted with the following
colors; turquoise=RDQ
pink=PPI green=PRI
red=Percentage. Back to the RDQ
measure. With the 1 month follow-up results on the same RDQ measure, the author
implies, again in the summary, that there are statistical differences between
comprehensive and soft groups. There is a contradiction between the authors
claim in the summary (EG significant differences) and in the body of the paper.
The body of the research paper states there are no statistical differences
between these (comprehensive & soft) groups as inspection of the
overlapping confidence
intervals further reveals (this will be discussed later in this
analysis). I have highlighted in turquoise
the passage that contains the inaccurate information contained in the abstract
summary regarding the RDQ score. (Abstract-RDQ-PPI-PRI-Inaccurate
Info). You will have to look
at the turquoise
highlighted passage carefully to understand the following. The part of the
passage we are interested in here refers to the RDQ (function measure).
Specifically I will translate the following information cited in the passage so
that you understand it; RDQ score 1.54 v. 2.86-6.5, p<0.001. 1.54 is the mean (average
of all the measures) score for the comprehensive massage group at 1 month
follow-up. If you go to the outcome measures chart (References)
you will notice that under comprehensive massage column and under the row
entitled follow-up (1 mo) and next to the row entitled RDQ score the number
1.54 appears. This is the 1.54 number cited in the abstract and turquoise highlighted. This represents the average score that the
subjects in the comprehensive group had on the disability questionnaire 1 month
after treatment had ended (this test has 24 disability items low numbers are
better than higher numbers). We will explain this disability measure later in
more detail. The before treatment mean for this measure for this group was 8.3
which is in the base line measures 2 chart (outcome measures) (References).
You will notice 8.3 in the 1st row RDQ score. The next number to look at is the
2.86 which is in on the outcome measures chart under comprehensive massage
column and under the row entitled follow-up (1 mo) and second column next to
the row entitled RDQ score. 2.86 is followed by the number 6.50. This
represents the range of RDQ scores from the soft group thru the sham groups as
you will note by looking at the outcome measures chart in the RDQ row. To
repeat the summary implies that there are significant differences "The
comprehensive massage therapy group had improved function (mean RDQ sore 1.54
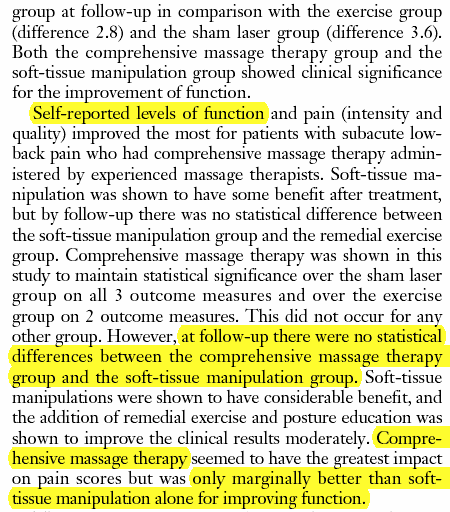
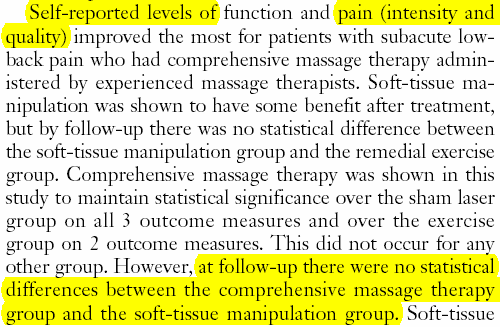
v. 2.86-6.5 ...)." but in the body of the research paper the author states
"Self-reported levels of function...., at follow-up there were no
statistical differences between the comprehensive massage therapy group and the
soft-tissue manipulation group". Comprehensive massage therapy....only
marginally better than soft-tissue manipulation alone for improving
function." (Body of
Research Paper-RDQ-Follow-up-No Statistical Differences). There appears to be a contradiction
between what the author wrote in the summary and what the author concluded in
the body of the research paper at least with regards to the soft tissue group.
The summary cherry picks the correct facts of mean differences 1.54 v. 2.86 but
infers from these correct statistics a misleading and factually incorrect
conclusion. It is carefully worded so that if these inconsistencies are noted
by critics the author can deny implying statistical significance but only noting
improvements 1.54 v. 2.86. This deniability clause is often used in spin so in
case you have to defend you can appear innocent. The spin master then could
claim that all you were trying to convey was that there was a clear improvement
in some scores while others were significantly different statistically. This
clever wording may be evidence of conscious intent. Certainly in and of itself
it may not be meaningful but as you will see many other elements of spin are
evident in this research paper and so increase evidence of conscious intent.
The p <0.001 in the abstract summary
(Abstract-RDQ-PPI-PRI-Inaccurate
Info) refers to the p value which
does indicate significant differences between at least one of the groups but it
does not tell you which one. Actually the significant differences were between
the comprehensive and exercise and sham groups but not between the
comprehensive and soft groups as aforementioned. By including the P-value the
author further implies difference between the comprehensive and soft when in
fact none exists. Professional researchers who are looking quickly thru the
abstract summary may just assume that the significant difference was between
the comprehensive & soft tissue group especially if they did not bother to
look in the body of the paper. The confidence intervals are further evidence
that there are no significant differences between the comprehensive and soft
both at post treatment and follow-up. We will talk about confidence intervals
in more detail later. For now, look at the outcome measures chart. Look again
at the RDQ score row and notice that next to the average score, 1.54 is the
comprehensive, there is a range of scores that are in parenthesis. The
comprehensive is (.69-2.4), for example. The rest of the scores for the RDQ
measure are summarized as follows; POST TREATMENT= Comprehensive
2.36(1.2-3.5) Soft 3.44(2.3-4.6) Exercise 6.82(4.3-9.3) Sham 6.85(5.4-8.2) The
confidence interval in each case is in parenthesis. Although not always true it
can be said that in general if the confidence intervals overlap between groups
then there is no statistical differences between the groups. The more these
intervals overlap the less significant difference. You will notice there is
significant overlap between the comprehensive and soft groups indicating no
statistically significant differences between these groups. You will also
notice there was no overlap between the comprehensive exercise, and sham groups
indicating that there were significant differences between these groups. 1 Month Follow-up= Comprehensive
1.54(.69-2.4) Soft 2.86(1.5-4.2) Exercise 5.71(3.5-7.9) Sham 6.50(4.7-8.3)
There was significant overlap between the comprehensive and soft groups
indicating no significant differences between these groups. There was no
overlap between the comprehensive, exercise, and sham groups indicating
significant differences between these groups.
The next color highlighting is pink also
in the abstract-Inaccurate Info chart whose link is above if you don’t already
have it open. This reports PPI pain intensity score (0-5) which is better when
lower. PPI score .42 v. 1.18-1.75 p< .001 As with the previous measure these
scores are average scores for the groups at follow-up. If you look at the outcome measures chart,
under the comprehensive column and under the 1 month follow-up row is the row
for PPI where the .42 number appears. This is the average pain intensity rating
for the comprehensive massage group at one month follow-up. The other groups
are summarized in the range listing 1.18-1.75 which begins the range with soft
group’s scores and ends with the sham scores. As previously noted the author
suggests that there were statistically significant differences between
comprehensive and soft both post treatment and at follow-up. The statistical
difference between the comprehensive and soft group noted in the summary for
post treatment scores is reinforced in the body of the research paper and the
non overlapping confidence intervals suggest. Comprehensive did statistically
better than in the soft post treatment. This then is a correct statement by the
author in the summary and the body of the research paper. (Body of
Research Paper-PPI-Post Treatment-Statistical Differences) These
significant differences between comprehensive and soft vanished at follow-up.
There were no statistically significant differences between these groups at
follow up. (Body of
Research Paper-PPI-Follow up-No Statistical Differences) The
abstract summary suggested that there were statistically significant
differences between these groups at follow-up as is noted in the (Abstract-RDQ-PPI-PRI-Inaccurate
Info) chart where the follow-up score of the comprehensive which is
.42 is listed vs. the follow-up score of the soft group which is 1.18 with a previous implication that there were
statistically significant difference between these score when in fact as stated
in the body of the research paper there were not. The confidence intervals
between these groups also supports the above analysis. The author was correct
about the post treatment measures but deceived us with the conclusions about
the follow-up treatements. The next color highlighting in the (Abstract-RDQ-PPI-PRI-Inaccurate
Info)is green. The following PRI scores (Pain Quality) (Scale=0-79) are listed
2.29 v. 4.55-7.71, p=0.006. 2.29 is the
average PRI score for the comprehensive group v. the average score of 4.55 of
the soft group and the range thru the sham group of 7.71. The p-value is listed
is .0006 higher than the other groups but still below the .05 minimum accepted
level. The summary scores for the PRI scores are as follows; POST TREATMENT=
Comprehensive 2.92(1.5-4.3) Soft 5.24(2.9-7.6) Exercise 7.91(5.2-10.6) Sham
8.31(6.1-10.5) 1 Month Follow-up=
Comprehensive 2.29(.5-4) Soft 4.55(2-7.1) Exercise 5.19(3.3-7.1) Sham
7.71(5.2-10.3) The summary
incorrectly suggests significant differences exist between comprehensive and
soft at both post treatment and follow-up while the body of the research paper
reports no statistical differences between these groups at follow-up and does
not mention any differences post treatment. The significant overlap between
confidence intervals both at post treatment and follow-up suggest no
statistically significant differences between these groups exist. The summary
also suggests significant differences between comprehensive and exercise both
at post treatment and follow-up. This difference was reinforced in the body of
the research paper only for the post treatment and not for the follow up where
no mention was made. The non overlapping confidence intervals for post
treatment scores between comprehensive and exercise support the congruent
observation (between the summary & body of paper statements) that there
were significant differences between comprehensive and exercise post treatment.
The statistical difference between comprehensive and exercise is no longer
apparent at follow-up as confidence intervals overlap significantly. The
implication in the summary that comprehensive and exercise were significantly
different at follow-up was incorrect. The red highlighted passage in the summary reports results
which are misleading. This same passage is found in the body of the research
paper which restates the same results. The research paper does not contain any
description as to how these statistics are derived but we can assume the 0 pain
scores were simply added and a percentage derived. The author was asked if she
had any references citing the validity of using the McGill pain scale ratings
(ordinal scale) as a ratio scale (percentage). I could find no references and
she had no further references either stating “I am sorry, I do not have other
references.” There is no support in the scientific literature, as far as I or
the author can discern, on the reliability of drawing ratio (percentage)
conclusions using the McGill pain scale. In addition the author excluded a
significant P-Value of .04 at one month follow-up for the ROM (Schober) group
stating "While it appears that the participants in the comprehensive
massage therapy group had the greatest range of motion at one-month follow up,
you might note that due to scheduling difficulties, not all the participants in
the soft tissue manipulation group underwent this test. I therefore did not
have confidence in this finding especially since the sample sizes were somewhat
small." If this is true for the ROM group why not then exclude the
percentage improvement statistics using the McGill pain scale for which no
research validity has been established. It is likely that the differences
between the comprehensive and the other groups although significant is not
dramatic. The summary scores with confidence intervals for the ROM groups are
as follows; Comprehensive 6.47(6-7) Soft 5.93(5.3-6.6) Exercise 5.39(4.8-6)
Sham 5.50(4.8-6.1). There was slight overlap between all of the groups
indicating that if there were statistical differences between any of the groups
is would have been slight with a higher than normal probability of error. These
results if used would have been less dramatic than the apparently large
percentage differences between the groups with regards to no pain scores.
Although these percentage statistics may have been correct using them was
misleading for the very reasons the author stated. There was an unusually high
drop out rate in the soft group before the 1 month follow-up measure could be
taken and none of the follow-up measures could be trusted because not all of
the participants scores could be measured. Yet the author used statistics
without scientific validation to mislead her readers into accepting false
conclusions which follow. This may be further evidence of conscious intent. The
author states her reservations, aforementioned, and yet used the statistics
anyway because they better and more dramatically support the following false
conclusions (see # 2 & 3 below) SUMMARY=
The author used the summary abstract to present a spin version of the research
results. The author cherry picked correct factual statistics (mean RDQ sore 1.54 v.
2.86-6.5 ect) and correct conclusions (statistical differences between some
groups did exist= p <0.001),
to present inaccurate conclusions (significant statistical differences between
comprehensive, soft & some other groups) by using misleading information
(improved function ect) while drawing accurate conclusions in the body of the
research study (No significant statistical differences between comprehensive
and soft). There appears to be conscious intent on the part of the researcher
to deceive us. The author’s carful wording of the results in the summary is an
example. Many readers of research simply don’t have time to read the entire
research study or look carefully at the charts. Most folks just read the
summaries. Conscious intent to deceive would place any misinformation in that
summary where it would likely be read quickly where a p value of less than .001
would justify the author’s positive findings. People simply don’t bother with
greater depth. Knowing this if you wish to deceive your readership the abstract
summary is the place to include spin. That is exactly where the author put it.
The aforementioned, makes a stronger case for conscious intent to deceive on
the part of the author.
2.)
Denial of Indefensible Assertions & Introduction of
Irrelevant Information to Support False Conclusions- The abstract summary
contains a false conclusion and what appears to be a blatant plug for the
institution which funded this research study. The author was asked why she
mentioned the “College of Massage Therapists” in her summary conclusion when
regulation of massage technique & the experience of the massage therapists
are not measured variables in this research (irrelevant information to support
false conclusion)? The author denied having done so even though a copy of the
research study was attached for the authors review. The author states “I do not
see College of MT in the summary conclusion. It is important to note that the
effectiveness suggested in this study is only associated with comprehensive
massage therapy by experienced therapists with additional training, and so
forth as noted in the article. The findings are not generalizable to other form
of therapies that one might consider similar.” The following link yellow
highlights the college of massage therapist reference. http://www.anatomyfacts.com/research/abstractlb.bmp
discussion of this is included in the questions to author assessed with this
link. (Blatant
Plug) The authors carful
placement of this information under the summary with a subheading of
interpretation is curious and then her denial disingenuous (appears honest but
is not). It is difficult to believe that with her memory of detail on other
questions intact why this one was such a stumper, especially given the
referenced attachment. As aforementioned, the inclusion of irrelevant
information in support of a false conclusion would suggest a conscious intent
to deceive and is a sign of crafted spin. The authors “can’t remember defense”
is weak but a strategic necessity given that blatant advertising plugs, and
irrelevant information were used to support false conclusions. This practice on
the part of the researcher would be difficult to defend. Although it may be
true that these therapists were registered by the college of massage therapists
and were experienced these were not research variables. Let’s discuss this
because it does require a deepening understanding of the concept of variable
and the distinction between independent, dependent, confounding variables. A
variable is something that varies or has the potential to vary and can be
identified or measured. Experimental research identifies variables to be
measured in the study. Even though in a complex study such as this there are
many variables which could be measured it is only the ones that are identified
in the research that actually are measured. For example, as aforementioned, the
education of the therapist, years of experience, and registration status of
therapists (College of massage therapists regulates standards and competencies
(ability to effectively combine remedial exercise and soft tissue for
example)). The variables of therapist education, experience, registration
status were mentioned in the study. These variables (education, experience ect)
were identified but not measured as part of the experiment. The purpose of any
experiment is to determine how one factor affects another factor. Research
questions help determine the purpose of the study. One such question would be
to ask whether there is a difference in disability, pain intensity, pain
quality, and ROM with different types of therapy or combinations of therapy
such as soft tissue mobilization, exercise. To determine whether any of these
therapies work you would then compare them with each other and with no
treatment. That is exactly what was done in this experiment. The independent variables are the types of treatment and the
dependent variables are the disability/pain measures and the potentially
confounding variable are the education ect. Independent variables are usually
treatments or medications and remain the same and dependent variables are
measured for any changes which may occur as a result of that treatment. The
experiment attempts to control all other possible influences except for the
influence of the independent variable on the dependent variable. A confounding
variable is not an experimental measure but rather a factor which may affect
the outcome of the research but is generally controlled to reduce its influence.
For example in this study we are not measuring whether the experience of the
massage therapists affects our dependent variables disability, pain ect. We
would want to minimize the influence of therapist education as a factor
affecting those dependent measures (pain ect). If we select therapists with
roughly the same experience level (in this case over 10 years) you can minimize
any differential effects on the subjects disability or pain ratings. The reason
for this is that experience may affect the treatments effectiveness. If you did
not select therapists with roughly the same experience and it did influence
outcome it would confound or confuse the treatment results. For example a
massage therapist in one group with 15 years experience may get better results
than a therapist in another group who has only 2 years experience. This would
make it hard to tell whether it was the independent variable or the confounding
variable that was producing any treatment effects such as reduced pain ect. By
keeping the confounding variables relatively equal you are less likely to
produce a differential treatment effect. That is a different effect between the
therapist with 10 years and the therapist with 2 years. That is since both
therapists have 10 or more years experience any effect from the experience
variable would be the same across groups. Since both therapists were also
registered, probably by the College of Massage Therapists, they both had to
take some type of test, prove educational training standards ect and so
presumably provided similar treatments to the subjects of this study. Since
these treatments would be relatively similar the advantage of superior training
would be neutralized across the groups in the same fashion. The variables of
education and experience when controlled do not confound or confuse the
measurements of the dependent variables the researcher wishes to measure. If
education and experience were to be studied this research project would ask a
different research question and be designed differently. The research question
might be; Does education and experience improve the effect of soft tissue
treatments for chronic low back pain. For this research study we might want to
have a group of massage therapists with more or less experience and measure
whether there are differences between the groups. We might want to do the same
with education varying registered vs. non registered massage therapists who
provide treatments to different groups. As you can hopefully see this is quite
a different study than the one Ms. Preyde has done. We cannot determine in Ms
Preyde’s study if education or experience make any difference unless we could
compare the effect of these factors with different groups. Ms Preyde’s study
did not compare these factors with different groups. The authors claim simply
is not valid. Ms. Preyde variously state that “the effectiveness suggested in
this study is only associated with comprehensive massage therapy by experienced
therapists with additional training…” Ms. Preyde further states in the summary
under interpretation "Patients with subacute low-back pain were shown to
benefit from massage therapy, as regulated by the College of Massage Therapists
of Ontario and delivered by experienced massage therapists." Hopefully it is
clear that Ms. Preyde’s study did not demonstrate the aforementioned. The
training and experience of massage therapists were confounding variables, to be
controlled (equalized) but not measured in this research study. The fact that
both massage therapists and the researcher who provided treatment to the
subjects were registered by the College of Massage Therapists are also
confounding variables to be controlled and equalized but not measured. This
means we cannot say that this study proved that getting registered by the
College of Massage therapists or having years experience makes any difference
whatsoever in the effectiveness of treatment as measured by the dependent
variables. These factors then are irrelevant to the findings of this research
and the author used this irrelevant information to support false conclusions
namely that regulated massage therapy by experienced therapists had anything to
do with the measured treatment effects. The fact that the author did this and
attempted to deny it, is further evidence of a pattern of behavior suggestive
of conscious intent to deceive. This researcher, Michèle Preyde, was a PhD
student at the time of the research and currently has earned her PhD in social
work PhD, RSW Assistant Professor Department of Family Relations and Applied
Nutrition University of Guelph. It is inconceivable that she is not aware that
these conclusions are faulty given her training and experience. PhD programs in
Social Work have extensive course work in Research Design and Methodology and
Statistics which refutes any claim of ignorance. Indeed it is unlikely that she
could have gotten her PhD without this knowledge. What is more difficult to
understand is that this research paper was published in a peer reviewed
magazine and accepted without revision by the funding source given their own Guiding Principles and Values of honesty. http://www.cmto.com/about/mission.htm
This research study has the appearance of being dishonest. It is difficult to tell
if this is a wide spread problem with just one case study example, but surely
the journal that published this paper and the funding source either did not
read the paper or choose to ignore the error. It is again difficult to
understand how these rather obvious errors were just missed like some
misspelling or grammatical misstep. SUMMARY The author with, apparent intent to deceive, cited
irrelevant information (College of Massage Therapists regulated education and
experience) to support a false conclusion (that treatment effect was due to
education and experience). The author then denied citing the College of Massage
therapist reference even though a copy of the research article was provided to
the author. This paper was peer reviewed by one of Canada’s leading medical
journals and the research was funded and presumably reviewed by the College of
Massage Therapists one of Canada’s Ontario province's health regulatory bodies.
Yet these publications and governmental regulatory bodies allowed the
publication and or promotion of this paper. This at the very least would
suggest a carful examination of these institutions review procedures.
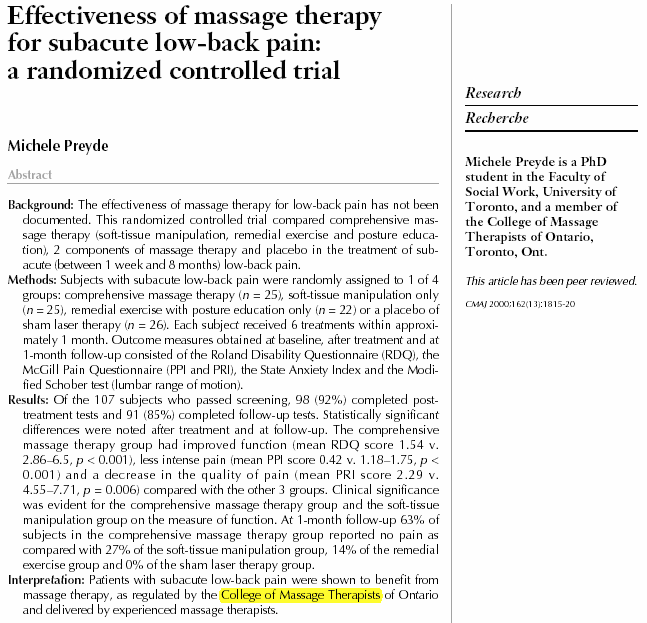
3.)
No substantive discussion of valid criticism, Avoidance
(Skirting) & confusion-This research paper was evaluated by Pedro (Physiotherapy
Evidence Database) using 10 validity standards which are widely accepted
measures of good research. This research paper was criticized for the following
problems; no Concealed Allocation, no Blind Subjects or Therapists, and no
Intention to treat analysis documented in the research. In a very brief
response to a question citing these standards when applied to this research the
author did not openly discuss Pedro’s evaluation factors. Her response and the
analysis is detailed with this link. (Validity
Standards) In this section is a discussion of the tactical necessity
of denial as a technique of spin. In the broad sense allowing for the validity
of any criticism the defender of a spin version of events or in this case a
research outcome is carful to protect and minimize acknowledgement of error. It
is similar to protecting a house of cards (a fragile structure) against the
wind. If you allow the wind to blow on it the whole thing could fall. Since the
author knows that her conclusions as cited in # 1 & # 2 above have serious
flaws if discussion of error is permitted it permits acknowledgment of
vulnerability. For example, the author could have acknowledged the no concealed
allocation in her research. This is where the screener is blinded to which
groups the people will be assigned to. She instead confuses the term concealed
allocation with blinding therapists and subjects to treatment groups. These
terms are separate and given that the author of this study is now a seasoned
researcher (7 years since the 2000 study) she should know the separate meaning
of the terms concealed allocation, Blind Subjects or Therapists. Just in case
though a link to Pedro was provided to the author. Still it is easier to defend
the difficulty in blinding therapist and so she choose to conflate all of the
terms and use the “to difficult” defense for all of the terms. This is yet
another sign of spin and yes adds to the mounting evidence for this author’s
conscious intention to deceive. SUMMARY-Pedro’s analysis of this research identifies 4 areas that
needed improvement, discussion of which could facilitate understanding the
problems in implementing good research and design criterion. The author’s
response was perfunctory, that is superficial. The author appeared to skirt or
avoid amplifying and discussing problem areas by confusing terms (concealed
allocation with concealed treatment) or not discussing the whole issue. In
responding to Pedro’s evaluation that there was no intention to treat analysis
the author responded “This is not entirely correct. Data were analyzed by
intention to treat”. The author implies
that some of the criticism was valid but did not discuss. We can only surmise
which aspect of critical evaluation was correct. In any case, the intention to
treat analysis was not included in the research paper and so the author is
essentially asking us to trust that it was done when trust is in an ever
shortening supply.
4.)
Pattern of Deceptive Practices- It is impossible to know
whether or not someone intends to lie by looking in their brain. Conscious
deception can be deduced by examining the person’s behavior to see if there is
a pattern of deception. The stronger the pattern the greater the chance that
the person was consciously lying with intent to deceive. That is this person
knew they were putting one over on you. They knew that they were trying to get
you to believe something that was untrue. Most people are offended by this
behavior and consider it unethical, fraudulent, and in some cases illegal.
Since this is a serious charge it is best that a group of people examine the
behavior and more or less vote, like a jury on whether a pattern exists. This
is how the legal system determines whether someone is lying. Although a group
of people may widely disagree on what constitutes a pattern of deceptive
practices it is the only way minimize the bias of an individual evaluator. The
argument for a pattern of deception on the part of the author in this research
study is summarized from above as follows; SUMMARY-The author placed information regarding the
outcome of this research which was either partially true but misleading or
factually incorrect in the summary of the paper while generally providing
accurate information in the body of the research paper. This selective
placement of information suggests a deceptive practice in that most readers
will only read the summary abstract due to time or other constraints and will
assume the information is accurate without looking carefully at the body of the
research paper. The author suggests in the summary that comprehensive massage
is statistically superior both at post treatment and follow-up to the other
three modalities. In fact comprehensive massage was superior to soft at post
treatment on only one measure, PPI and statistically identical on all the other
measures both at follow-up and post treatment. Comprehensive was superior to
exercise and sham on several measures post treatment (RDQ, PPI, PRI) but
retained statistical superiority to exercise on only RDQ PPI while continuing
its superiority to sham on all measures. The aforementioned contains misleading
or inaccurate information suggesting that comprehensive is superior to all 3 groups on all 3 measures both post
treatment and follow-up when in fact comprehensive was superior to soft at post
on one measure but not superior to soft at follow-up on any measures. Further
comprehensive was superior to exercise and sham on 3 measures at follow-up,
retained superiority to exercise on 2 measures and sham on 3 measures at
follow-up. This amalgam of part factually correct, part inaccurate information
which misleads the reader into assuming that comprehensive massage is superior
to all of the groups both at post treatment and follow-up on all measures. This
misleading wording is another example of a deceptive practice. The next
deceptive practice is the author’s use of percentages (ratio statistics) to
report differences between groups on the percentage of subjects who reported no
pain ratings at follow-up. This is because these statistics would be especially
vulnerable to the drop out rate at follow-up which was especially high in the
soft tissue group. The author herself had concerns about the high drop out rate
especially in the soft group and did not report ROM significant differences
between groups stating “I therefore did not have confidence in this finding
especially since the sample sizes were somewhat small." Yet the author
used percentages to report differences in the McGill intensity scale (PPI) even
though the author could not cite research to support such a use. Percentage
measures with such small groups 20 or so would be extremely sensitive to a drop
out rate of three for example 3 people dropped out of the soft group before
follow-up so instead of 27% no pain ratings in the soft tissue groups the
rating could jump up to 41% no pain rating if those three had all rated no
pain. If those that dropped out of the comprehensive group had been added it
could make the statistics in favor of comprehensive much less impressive. The
author used these statistics because they appear impressive yet upon close
examination are deceptive in that high drop out rates invalidate the results,
and there is little research to validate interpretation to the McGill scale in
this manner. This is then another deceptive practice. The final but in some
ways most egregious (best example) deceptive practice involved a blatant plug
of the College of Massage therapists which funded this research study. The
author places this in the abstract summary under a heading labeled
interpretation. The College of Massage therapists (CMT) is a Canadian
government institution which regulates the massage therapy standards in
Ontario. To be a registered massage therapist, CMT, probably tests knowledge
and skills and may require certain educational and experience requirements be
met. The author is implying in this summary that the massage therapy in this
study that most benefited patients with chronic low back pain was the type
regulated by CMT. This would probably be some combination of soft tissue
manipulation and exercise as in the Comprehensive group. Further in the same
passage the author implied that the good benefits were also as a result of the
comprehensive massage as delivered by experienced massage therapists. To state
this succinctly the author is suggesting that patients with subacute low back
pain benefited from massage therapy (same as provided to the Comprehensive
massage group) from experienced massage therapists who were CMT registered. On
the surface this sounds like a reasonable assumption until you begin to think
about what this research project didn’t measure. It didn’t tell us whether or
not the experience of the massage therapist benefited subjects on any of the
rating scales that were measured disability, pain ect. To measure the
experience factor we would have to include more groups with inexperienced
therapists vs. experience therapists to determine if there was improved benefit
from more experience. This research project didn’t measure whether CMT registration benefited subjects
in any way. To do this you would have to have additional groups also eg registered
vs. non registered therapists. Neither the experience of the massage therapists
or the CMT regulated techniques (CMT registration) were studied in this
research project and so the inclusion of these factors in the summary were
further examples of deceptive practice. The author is asking us to draw false
conclusions (CMT registered experienced therapists benefited subjects) from
irrelevant information (experience & registration status of therapists).
When the author was asked why she found it necessary to mention CMT at all in
the summary she denied having done so. Further part of the exercise therapy was
not even provided by CMT registered therapists but rather by certified personal
trainers. CONCLUSION-The
author utilized several deceptive practices which suggest conscious intent to
mislead the reader into accepting false conclusions. In particular, she implied
statistical significance when there was none especially between the
comprehensive and soft groups by using deceptive and targeted statistical
reporting. This included placing misleading information in the abstract summary
where hurried readers could be easily mislead. The author also used percentage
of no pain reporting as a follow-up scientifically unproven statistic knowing
that this measure was probably invalid due to high drop out rates and small
sample sizes. The author blatantly plugged the research institution which
funded the research by suggesting the study showed that experienced massage
therapists registered by this institution (CMT) benefited subacute low back
pain. This interpretation by the researcher is an untruth because this research
project did not determine whether experience, education, or institutional
registration status benefited subacute low back pain. The combined accumulation
of several deceptive practices does not suggest that these were random clerical
errors or oversights but rather reveals a pattern of conscious intent to
deceive on the part of the author of this study. Further it seems likely that
those who reviewed this study must have known or should have known that these
unethical research practices were evident and these same reviewers should have
forced revision of the study. None of the reviewers of this study which may
have included University Personnel (University of Toronto), Peer Reviewers (CMAJ),
and editors of Canada’s
leading medical journal (CMAJ)
forced revision. Further the College of Massage Therapists, the source of
funding with its pledge to honesty should also have caused revision of this
study. As far as can be determined none of these unethical practices were
challenged or changed. This seems to at least in the case of this study imply a
system of checks and balances which is broken and or hijacked by business
interests over science.
References
http://en.wikipedia.org/wiki/Political_spin#Spin
http://www.m-w.com/cgi-bin/dictionary
http://www.aicpa.org/PUBS/JOFA/oct2004/lawrence.htm
FRAUD DISCUSSION
Is this research fraud though? We have made the argument for
a pattern of deception which implies conscious intent but are these fraudulent
practices, that is do they harm anyone. The following is a discussion of harm.
We are not necessarily talking about the penal code version of fraud but rather
from a non-legal perspective. We may have to rely though on the more criminally
defined fraud because there does not appear to be a lot of literature on
research fraud. This does not appear to be an area which has been carefully
studied.
Legal Definition of Fraud
“All multifarious means which human ingenuity can devise, and
which are resorted to by one individual to get an advantage over another by
false suggestions or suppression of the truth. It includes all surprises,
tricks, cunning or dissembling (to hide under a false appearance), and any
unfair way which another is cheated.”
Source: Black’s Law Dictionary, 5th ed., by Henry Campbell
Black, West Publishing Co., St. Paul, Minnesota, 1979.
As you see from the above legal definition the distinction
between fraud and spin/lying is that in the case of fraud there is harm done to
someone who has been cheated. Fraud shares many similar qualities with spin
tactics eg statistical tricks, cunning and dissembling. It may become a legal
issue when actual monetary damage can be assessed. Certainly by the legal
definition above this research would share many of the attributes.
Research Fraud
Caltech (California Institute of Technology) Ombuds
(Ombudsman= one
that investigates reported complaints (as from students or consumers), reports
findings, and helps to achieve equitable settlements) office defines fraud as;
“serious misconduct with the intent to deceive, for example,
faking data, plagiarism (coping others work), or misappropriation (stealing) of
ideas”
In the case of research fraud the Caltech definition requires
that data be faked. There is no evidence that the statistics were faked in this
research project nor any evidence of plagiarism, and or stealing others ideas.
By this definition the research paper is not fraudulent although the above
definition is probably a brief summary and does not include the Caltech ombuds
office full definition.
Harm Analysis
The following will offer some of the arguments that this
research study constituted a fraud at least with regards to harm analysis.
First was there harm done to any persons or to the Profession
of Massage.
To the extent that prospective students give credence to
research findings there may have been financial harm. After all education can
be expensive and following the lead of this research students may pay for and
complete a costly educational program as well as pay for and obtain
registration with the College of Massage therapists. That is to the extent that
this research influences students to unnecessarily spend money this could be
assessed as monetary damage.
Consumers may be harmed to the extent that they base their
choice of treatment modalities on research findings. This research study plugs
comprehensive massage therapy which is both more expensive and time consuming
than the other treatment modalities which in fact were as effective or nearly
as effective. Folks may spend more money and time than they have to. People
could get basically the same results with less cost and less time spent in
treatment for the relief of their low back pain.
Science itself is damaged along with the profession of
massage when it becomes apparent that research results can not be trusted and
further that business concerns trump all else. Once a professional code of
ethics is broken all of the loopholes in research will be seen by the general
public and the scientific community as a probable opportunity for fraud. Much
research that might be trusted won’t. In other words, it will be more expensive
to do massage research because in order to earn trust more research controls
against fraud translate to higher research cost. That means less massage
research.
Conclusion
By the incomplete and summarized definition of fraud offered
by just one university source (Caltech) this research study is not fraudulent.
That is there is no evidence of “faking data, plagiarism (coping others work),
or misappropriation (stealing) of ideas”. It would probably be considered
fraudulent though by most university sources if you include misleading the
reader to false conclusions which may be equally harmful to the public and
science in general. By the legal definition of fraud this study is probably
fraudulent. That is, “….false suggestions or suppression of the truth”, for the
purpose of fooling or cheating people to the advantage of the perpetrator. In
this case the researcher wants us to become registered massage therapists by
the College of massage therapists and go to schools that teach some form of
comprehensive massage therapy (combine soft tissue and exercise) and wants
clients to pay for more expensive therapy. The harm here is financial, in that,
prospective students may pay out money for education they don’t need and
clients may spend more money and time than needed on unnecessary therapy.
Science is harmed since massage research may not be trusted unless more
expensive research and design measures are employed thus reducing the amount of
research.
References for Fraud
http://www.its.caltech.edu/~ombuds/html/research_fraud.html
http://www.anatomyfacts.com/Research/fraud.pdf
SIDEBAR END
The following discusses the self rating scales used in this
research study. The first scale (Disability Questionnaire) asks
the client to check off 24 activities of daily living that are impaired because
of back pain. For example the questionnaire asks whether because of back pain
the person does the following; use a handrail to get upstairs, get dressed more
slowly, can only walk short distances because of back pain. The more items
checked by the client the more disabled that person is considered because of
their low back pain. The subjects of this research study were given this
disability questionnaire before, immediately after, and one month after
treatment. A score of 0 would mean a person had no disability and a score of 24
the maximum disability because of their low back pain. As we have discussed
since this scale is self reported we couldn’t be sure that the measure of
disability between the numbers is equal. It is equally impossible to neither
know nor establish for sure if a 0 measure means a complete absence of
disability from low back pain since not all the of the disability measures may
have been included in this study and self evaluation may not be accurate.
Technically, it would then be impossible to obtain a statistic such as a mean
(average) or deduce ratio measures such as a score of 10 is twice as disabled
as a score of 5 or for that matter establish that a pretreatment score of 10
and a post treatment score of 5 represented a 50% disability improvement.
However, in this research study and other studies those are the conclusions
reached with this instrument, which is widely used and validated. It’s
validated in part because it has been associated with objective measures of
functional improvement. In this study, as aforementioned, there was no
objective functional improvement between pre, post, and follow-up measures.
To score this disability questionnaire, find the difference
between scores, divide the larger number into the smaller number (10-5=5/10=.50
or 50%). If a pretreatment score was, 10 and the post treatment score was 5
that represents a 50% improvement. If the pretreatment score was 5 and the post
treatment score was 10 that means your client is 50% more disabled after
treatment.
The second scale for measuring progress in this study was a
self-rated pain scale (Pain Questionnaire). Two scores
are derived from patient completion of this questionnaire. The first score
(PRI) is the total of the ranked pain attributes of the 20 questions. Each
(PRI) attribute in descending order represents increased discomfort rated with
the number of the tick mark in the category. For example, number 1 has
flickering, quivering, pulsing, throbbing, beating, & pounding. If you
selected pounding, your rating would be 6. Once you completed all of the 20
questions, add up the scores and put the total into the PPI box. The second
score is the (PPI) which is a scale of pain intensity of 0 to 5 (0=no
pain,1=mild, 2=discomforting, 3=distressing, 4=horrible, 5=excruciating). Put
the PPI 0-5 score in the PPI box on the form. This questionnaire was also
completed before, immediately after, and one month after treatment. These
self-rated pain ratings have some of the same problems as the previous disability
questionnaire. No equal measure between numbers and no absolute 0. The greater
the (PRI) score the more pain a person experiences as the lower score indicates
less pain. Pain intensity (PPI) works in the same way with 0 denoting no pain
and 5 the maximum pain. These scores are added up for each group and mean score
for that group is derived at the various measurement intervals.
The third self-rated measure probably goes under the category
of psychological testing. The author sells these tests on the internet and so
it impossible to get a copy unless you want to pay $30. It is therefore
impossible to evaluate the test questions without a copy. In general, it takes
about 10 minutes to complete and is both a personality inventory and a measure
of the current anxiety state. It includes 40 questions 20 to assess the current
anxiety state and 20 to assess the personality traits of the individual.
Specifically the test was used in this research to determine a person’s anxiety
before performing low back movements. Presumably, if a particular modality was
effective a research subject will be less anxious prior to the movement. This
measure was also taken pre, post, and at follow-up. I can find no references
for its use with range of motion activities but otherwise this test has been
validated as an accurate measure of anxiety prior to imminent surgery, dental
treatment, job interviews, or important school tests. Since this is a
self-rating test it has the same problems as outlined above.
The fourth measure is the only objective
measurement in this research study (Lumbar Range of Motion Test).
As aforementioned, this test was completed by 3 physiotherapists who were blind
to which group each subject was allocated. The test is a simple objective
measurement of the distance between two points at mid distance 10 cm superior
and 5 cm inferior to the PSIS (Posterior Superior Iliac Spine) midpoint during
flexion and extension activities with the centimeter result recorded for both
measurements. Norms have been established. 7 cm is considered normal. The
intervals between the numbers is equal and there is a true 0 point so that
numbers can be added together and divided by their number to find a true mean
and ratio statements can be accurately made. For example 2 cm improvement in
range of motion is exactly 2xs the amount of 1-centimeter improvement. The
measurements can be checked by others for accuracy. Since the Physical
therapists were blind, to which research subjects were in which groups they
could not influence their measurements. In short, we can better trust that
these measurements are much less likely influenced by researcher bias. The
following may be a little technical. The author of this study did not report
statistical differences, post treatment, between any of the groups on the only
objective ROM measure (Schober) which was also the only measure evaluated by
blinded assessors. There is an inconsistency when you examine the data tables of
the study. These tables show that at follow-up, there are significant P-Values,
(probability that the significant difference between groups is due to chance
alone). If the p value is lower than .05, for example there is significant
difference between two or more groups). When you look at the tables they reveal
significant differences between the groups for the ROM (Schober) measure (Outcome Measures)
but the author does not reference or explain this result. After questioning the
author reports the following; Questions to Author-Question
# 5
Lets roll this around in our minds to hammer in the concept.
Look at the table again under the heading secondary outcome measures and under
follow-up one month. Look at the row heading modified schober test and under
the column heading P-Value and you will notice .04. Because this is under .05
it means there was a significant difference between the mean scores of at least
one of the treatment/control groups. The number doesn’t tell us which one. More
complicated statistical tests would have to be completed to find out between
which groups there were differences.
What does this mean exactly? What is this P-Value? Please
re-read the section on coin flipping. It states “When you
see p= or P-Value= that is the probability that your results are due to
chance.” In the case above the P-Value is .04. This means that there are 4
chances in 100 that the differences between the means of your groups are not
significant and due to chance alone. Think about that because it is sometimes
hard to get the mind around this concept. Patience, Persistence, Progress. This
.04 number tells you what chance you have of being wrong if you concluded your
study by saying that there were significant difference between your treatment
groups. To most scientists any number below 5 chances in 100 is acceptable. I
have no idea why that cut off was decided. If you want to sound really smart to
a researcher just ask them what their P-Values were. This is kind of like going
to a foreign country and saying the only phrase you know in that language at
which point the native speakers tear off into spirited conversation leaving you
speechless. The researchers may assume you are a native speaker and give you
way more information than you wanted. But at least there was a brief moment of
glory.
Meanwhile the author of this study may not have included
reference to this outcome measure because most research papers have a P-Value
of < .001. Look back at the outcome measure table with the outcome measures
link above. Notice that most of the P-Values are < .001. This means that
there is less than 1 chance in a 1000 that you would be wrong in a conclusion
that there were significant differences between your groups. Those are pretty
good odds by anyone’s standards. The P-Value of .04 (4 chances in a hundred)
means that there may be an unacceptably high probability of error for this
researcher. It also means that the differences between the groups on this
objective measure were not that significant.
If it could be established that the lumbar range of motion of
the subjects of this study were within the normal range pre treatment then it
may be less likely that the range of motion will change that much since it was
in the normal range anyway. In the case of the ROM of the subjects of this
research study eyeballing the data it look as if there ROM was a bit low. It is
also possible as aforementioned that because there was at least the possibility
of researcher bias that the self reported measures did not accurately reflect
the person’s objective disability since they were encouraged to report
improvement when there was none.
RESULTS
For the next section, please open and keep open the following
three windows which you can refer to during the explanation. (Baseline Measures 1)(Baseline Measures 2)
(Outcome Measures)
(Outcome Measures Results)
There are lots of scores in these tables and so it is kind of confusing. That
is why it’s best to keep all of the above windows open. I will refer to the
windows by their name so that you will know which chart we are commenting on.
Review the concepts of probability
so that you can better understand the following. To find the P-Value score look
at the outcome measures chart, the P-Value is in the very last column of the
chart. In looking at the P-Values you will also notice that they are
significant for most of the groups. That is in most cases < .0001 or 1
chance in 1000 that the difference in at least one of the groups in the row is
due to chance alone. Certainly all of the measures identified under the column
variables (A variable is something that varies-In this case disability and pain
lessen with treatment), except for the Schober (ROM) test, have P-Values under
the acceptable probability of error limit of .05.
At this point we are “eyeballing” the data in the chart to
become more familiar with the scores. We are looking at the data in a general
manner. By the way you will impress statisticians if you use the term
“eyeballing” because folks “in the know” use that term. The P-Values as
aforementioned tell us there are differences between groups but we still don’t
know which groups are significantly different. Practice looking at charts will
help you understand charts in other research papers when you read them. The
charts give us the raw data and are sometimes useful in finding information
that was not spelled out in the research paper which may include
inconsistencies in the research findings.
We can look at the chart for the scores pre treatment which
is called baseline data (See Baseline Measures 2). These are the scores which
were taken prior to treatment. The column headings are not visible but it
follows the groups in the Outcome measures chart. Column 1 (Comprehensive
massage,) Column 2 (Soft Tissue massage), Column 3 (Exercise/Postural), and
Column 4 (Fake Laser). The measured test is listed in the left hand column RDQ
(Roland Disability Questionnaire=0-24), PPI (Present Pain Intensity=0-5), PRI
(Pain Rating Index=0-79), State Anxiety Index Score (20-80), Modified Schober Test
(No score range listed). The range of scores for each of the measures is listed
above in parentheses.
The body of the chart is devoted to the scores which are mean
or average scores. As we have previously explained the mean score is a
summation of all the scores of the test by each of the clients divided by the
number of clients. If you look at the bottom of the chart there is some
information in small print. We will refer to that information as we go along.
You will notice on the far right hand corner of the chart there is a cross
after each of the rows. If you go to the small print explanation beside the
cross it states “No significant difference between groups”. At baseline, then
that means the groups were statistically identical. This suggests that there is
no evidence of biased assignment (No Concealed Allocation)
The scores in parentheses is a statistic known as a standard
deviation. This is a complex (I won’t explain the complicated formula) but
important statistic. It’s going to take some story telling and your patience to
understand the concept. The standard deviation is a measure of how much the
average score deviates or varies from the mean. Look at the baseline measures 2
at the first column, first row. 8.3 is the mean baseline disability score which
given a total of 24 possible is roughly in the bottom 1/3 of scores. The
statistic in parenthesis to the right of this score is 4.2 and is the standard
deviation. This means that your average score deviates 4.2 points from the mean
score of 8.3 and is not more than 12.5. Each measure of the standard deviation,
in this case 4.2, is considered 1 standard deviation from the mean. For
example, one standard deviation from the mean would be 12.5 (8.3+4.2) and two
standard deviations would be 16.7 ect. If you measure enough of anything, tree
trunk size or peoples height and weight something strange happens. You have to
have around 100 measurements for this to work although it usually happens
somewhat after 30 measurements. This of course is truer if you pick things
randomly. Obviously if you purposely went out and pick very large examples and
small examples it would throw this phenomena off. Assuming a random selection
and enough measurements you would get what is called in the biz a normal
distribution. This is another term you can use to impress researchers ask them
was your distribution normal? All of the more complicated statistics that
compare control groups with treatment groups are based on the assumption that
the distribution of scores is normal. If the distribution is not normal then
the statistics are not as valid. Also with a normal distribution and the
standard deviation you can predict the percentage of scores that fall within a
certain range. In our case with these disability scores we can predict that 68%
of our scores will be between the scores of 4.1 and 12.5. That is between 1
standard deviation below and above the mean or roughly 34% of the scores below
and above the mean score of 8.3. We can do this for each of the 4 groups if we
wanted to get a feel for the data.
The numbers right under the chart below are the standard
deviation 1 2 ect. The weird symbol beside the number is the symbol for
standard deviation. Don’t worry about the z scores for now. The decimal numbers
.3413 is the same as 34%.
Normal Distribution
We don’t know in this research study whether or not the distribution
was normal. The author says it was when questioned but to be sure we would need
to look at more detailed data charts which the author no longer has.
What does a distribution look like when it’s not normal and
what does it mean? Statisticians call abnormal distributions negatively and
positively skewed. The word skew is similar to the word skewer which is long
and pointed and is thicker at one end than the other (not symmetrical). A
skewed distribution has a thin point on one side. If the thin point is below
the mean it is negatively skewed and if the thin point is above the mean it is
positively skewed. For your review and comparison all of the distributions
along with their estimated percentages of scores are depicted below.
If the distribution of scores for this study was negatively
or positively skewed we might be concerned about the possibility of selection
bias as we discussed above (Bias). Given that the number of
people in this study and the scores derived from those numbers nears 100 we
would expect a normal distribution. The author of this study has been contacted
and asked regarding the symmetry of the distribution. The author reports that
there were normal distributions. If the screener/assignment person selected
people with selection bias it might show up as a skewed distribution. For
example if more disabled clients were selected there would be a negatively
skewed distribution because more scores would cluster above the mean and fewer
scores would be below the mean. Conversely if less disabled clients were
selected there would be a positively skewed distribution with less disabled
clients clustering below the mean. Given that the groups are statistically
identical pretreatment there is no evidence of selection bias and the
distribution is probably normal. The groups derived from a normal distribution
are also likely to be normal even though they are much smaller than 100 or even
30. In the case of this study even though it may have the appearance of
selection bias there is no evidence that the bias actually occurred. This we
can tentatively conclude by “eyeballing” the baseline data chart (baseline
measures 2). We can’t be certain of the conclusion but it is certainly worth
preliminary consideration.
What else can we tentatively conclude by just looking in a
general way at the numbers in the baseline chart 2? As far as the RDQ
disability score it appears as aforementioned that none of the members of any
of the groups were that disabled by their low back pain. The standard deviation
as aforementioned gives you a general idea of how widely the scores vary from
the mean. It looks like for most of the groups it is about 4 points. This again
confirms that most of the clients in this study were not that disabled since
68% of the groups were within 4 points of the mean score of 8.3. It would be
helpful if we had normative values for all of these measures so that we can
compare this sample with other groups of people who have completed the
questionnaire. Where possible I have listed those normative values.
As far as looking at the data from the baseline chart 2 for
the PPI pain intensity score it also appears most clients experienced low grade
pain. This was a O-5 scale rated as follows; 0=No Pain, 1=Mild,
2=Discomforting, 3=Distressing, 4=Horrible, 5=Excruciating. Most of the folks
in the groups reported pain somewhere between 2-3 which would be between
discomforting and distressing. The standard deviation looked to be around 1
either side of the mean which results in 68% of the clients reporting pain
between mild and distressing. This group is just not experiencing that much low
back pain. That jives with the above mild disability self rating.
The PRI scores at baseline were also in the low range. The
PRI measures the quality of pain on a 0-79 scale. The baseline 2 scores of this
study ranged from about 10 to 12 and there were no significant differences
between the groups. The standard deviation is between 5 and 6 points which
gives us a range of between 6 and 16. This still means that there are low end
quality of pain ratings.
The State Anxiety Index score has a range of between 20 and
80 which is a pretty large range with higher anxiety measured with higher
scores. Again we don’t have any normative values so it’s hard to know for sure
what the scores mean but this is just practice getting familiar looking at the
charts. This test takes about 10 minutes and measures current anxiety prior to
low back movements. Again the anxiety level pretreatment appears to be in the
low end between 30 and 40. The standard deviation is around 10 points on either
side so you can say that 68% of the scores are between 25 and 45. This would be
low to mid range anxiety scores pretreatment. We would expect if treatment is
effective that these scores should go even lower.
The last measure is the modified Schober Test which is in
centimeters (cm). More than any of the other tests we need some normative data.
Normative statistics tell you that how the average person taking this test
does. In this case the average person taking this test is able to achieve a
range of 7 cm. Please review how the test was conducted (Schober).
The chart lists the average centimeter movement of the spine during flexion and
extension. The research study does not tell us if the flexion and extension
measurements were totaled and then averaged. I will assume that is what was
done. It looks like there was only a centimeter or 2 of range in the standard
deviation and that about 5 centimeters of average movement for flexion and
extension. That means the range that captures the 68% of the people is between
3 and 7 centimeters movement. There are no significant differences between the
groups. It appears that the average range of motion for this group is a bit
low.
What about characterizes of clients. Look at baseline chart
1. Let’s take a look at the chart to see what kinds of clients were selected
for the study. It looks like most of the clients were married, overweight,
university educated women equally split between not working/retired and sitting
at a desk/movement who are in their 40’s who had been suffering with current
level of low back pain for about 3 months which was caused by bending
lifting/mild strain injury and have had previous episodes of low back pain in
the past. There were no significant differences between the groups on sex, age,
weight and marital status, while there may have been differences between the groups
on education level, Occupational Activity, and cause of problem.
Now how in the world do we know all of this by just quickly
looking at the chart? Remember these conclusions are tentative but useful in
just getting the big picture. There is always going to be error when you
generalize and yet it gives you a feel for the data. Let’s examine how it is
the above conclusions were reached. Look at the base line 1 chart again. The
crosses in the far right hand column of the chart mean that there was no statistical
difference between the groups in the indicated row. Rows not marked with the
cross have differences between the groups which are significant.
Looking at the first row which is the mean age you can see
the range is from 42 to 48 years. In parenthesis we see the standard deviation
for each of the groups and it appears to be a rather wide spread. In the first
group for example it is 16 years which means 68% of the ages are between 31
years old and 63 years old. Quite a wide spread of ages. The soft tissue group
had an even wider spread of age with a standard deviation of 18 years. You can
do the math for the rest of the groups as by now you should be able to
calculate the spread yourself.
The next row tells us the percentage of women in the groups
which range from 41% to 56%. All of the groups are dominated by women except
the exercise group which has a majority of men. There are no significant
statistical differences between the groups. When there are no parenthesis it
means no standard deviation is available.
Looking quickly at the % of clients at the various
educational levels it appears the highest percentages are at the university
level. I’m assuming university level means graduate work and college
undergraduate (It is not clarified in the study). The next most frequent is
high school and then college. This is an educated group. Probably because many
were recruited thru university E-Mail and it appears that this might have been
a town with a local college. There were differences between the groups on
education level.
A body mass of between 25 and 30 is considered overweight and
in the next row (mean mass body index) you can see that most of these women
would be considered overweight by that standard. There are no significant
differences between these groups.
The next several rows separate out the various daily
activities (no work, student, desk, physical labor ect). There are significant
differences between all of these groups. Some of the groups stand out. There seem
to be greater percentages of folks who are at their desk either with or without
movement and folks who are retired or not working. There does seem to be wide
variation between the groups activities but not enough to make much of a
difference in self reports of disability/pain or objective ROM as we have
observed above.
The next row tells us how long the clients have had their low
back pain and there are no significant differences between the groups. It looks
like most of these clients have had their low back pain for about three months.
There is also a wide range given the standard deviation which ranges between 8
to 11 weeks. That means clients could have had their low back pain anywhere
from two weeks to 5 months. This is a broad estimate by the way but gives you a
sense of the wide difference between subject’s reports.
Between 50% and 68% of the clients reported a previous
episode of low back pain and there were no significant differences between the
groups.
The next several rows are devoted to describing the cause of
the low back pain and significant differences exist between the groups. It
looks like at least for some of the groups bending and lift and mild strain are
the most frequent causes.
Hopefully you can see why “eyeballing” the data is useful.
You can find out a lot before you even read the research paper. When you know
what the numbers mean it makes you a much smarter consumer of research. You are
less likely to be fooled by research and more likely to demand that researchers
give you the real deal.
What about outcomes in this study post treatment and
follow-up? Does eyeballing give us some general information about how the
groups did after treatment? Look at (Outcome Measures)
chart if you have it open or click and open the link for a separate window. The
set up for these numbers is a bit different. The standard deviation now has a
separate column and the numbers in parenthesis represent a new statistic called
a confidence interval. A confidence
interval is simply a range of values with a lower and an upper limit. With a
certain degree of confidence (usually 95% or 99%), you can state that the two
limits contain the parameter. In this case the parameter is the mean or average
measure of the group. The significance of confidence intervals is to predict
how close the mean of your sample is to the mean of the larger population of
all the people who have low back pain and who have been screened in the manner
of this research study. In statistics a population means all the members of a
specified group. Sometimes the population is one that could actually be
measured, given plenty of time and money. Sometimes, however, such measurements
are logically impossible. Inferential (conclusions about a population from a
sample) statistics are used when it is not possible or practical to measure an
entire population.
Of course it would be beyond the
budget and scope of this study or most studies to screen millions of people to
obtain the total population of people who fit into the criterion of this study.
Statisticians use the term population to mean the larger group of people while
knowing it is rare to actually know exactly what the total population for any
study would be. A sample, of course, is some part of the whole thing; in
statistics the “whole thing” is a population. The population is always the
thing of interest; a sample is used only to estimate what the population is
like. Interferential statistics will help us make inferences (generalizations
(with calculated degrees of certainty) about the larger population) by just
looking at the sample. One obvious problem is to get samples that are
representative of the population. The confidence interval tells you that if you
took 1000 samples for example where your means of all those samples would
likely be. That is your mean would be between the upper and lower numbers.
The probability is stated as a
percentage of how confident you will be that this is true. Usually stated as
95%. There is a 5% chance that you will be wrong. This is different from the
previous probability statistics, aforementioned where the emphasis was first on
the probability of error (< .0001=less than 1 in a 1000 chance of error).
The confidence interval could be seen as a measure of how much “wiggle room”
you have with your statistics and it follows within what range the populations
mean is likely to be.
For example, if you look at the
outcome measures chart you will notice the RDQ score, post treatment, under the
comprehensive massage group. The RDQ score is 2.36 with a confidence interval
of 1.2-3.5 which means if we went back out to another community and did the
same study groups/treatments the mean of this group would end up somewhere
between 1.2-and 3.5. This is several measures better than our starting off
score of 8.3 (See baseline 2) which is outside of both the upper and lower
margins of the aforementioned confidence interval. This suggests that even if
you took many other samples even the upper end mean of 3.5 would at least from
an eyeballing viewpoint be significantly better than the pretreatment score of
8.3. Confidence intervals can also be used to roughly estimate whether there
are significant differences between groups by determining whether or not
overlap exists between the confidence intervals of the groups (see
below).
To recap, if you look at the pre
treatment score baseline 2 and then at the post treatment and or follow up score
you can see if the means appear significantly different. Apply the confidence
intervals with upper and or lower end to see if those differences still seem
significant. The standard deviation of this group is 2.8 which further informs
the eyeball analysis. This gives a range of from 0-5.16 where 68% of the scores
would be placed. The higher end of this range would be less impressive and of
course outside of even the wiggle room provided by the confidence intervals.
The other number which is new to
this chart is N=25, for example, which tells you the number of people in the
groups who actually completed the study. The range appears to be from around 21
to 26 but in most cases around 25 which means most people who began the study
completed it since 25 people were assigned to each group from the start.
There are a lot of numbers on this
chart and so it can seem a bit confusing. Remember we are only interested in
looking at the chart in a general way to pick out the most significant numbers.
The research paper for this project did not report differences between
beginning and ending scores since its focus was on comparing the differences
between the groups, eg comprehensive soft tissue ect.
Matriculation and Drop Out
Number of people in each group; Pre
Treatment=Comprehensive 26 Soft 27 Exercise 24 Sham 27 Total=104 Post
treatment= Comprehensive 25 Soft 25 Exercise 22 Sham 26 Total=98 Follow-up=
Comprehensive 24 Soft 22 Exercise 21 Sham 24 Total began=104 Total Completed=91
Total drop out= 13 See matriculation chart for further details.
107 were selected for the study who
met eligibility requirements. 3 dropped out before randomization. 104 people
were randomly assigned to one of four treatment groups. 2 people dropped out before
receiving any treatment, one in comprehensive and one in exercise. 4 people
started treatment but did not complete it, 2 in soft, 1 in exercise, and 1 in
sham. 7 people dropped out of the study before follow-up measurements could be
taken comprehensive 1, soft 3, exercise 1, sham 2. 91 completed the study in
four groups.
The next section is a bit
technical. If you want to cut to the chase and just read the summary scroll
down or click (Summary). It would be good to open
and keep open for reference. (Outcome Measures Results)
POST TREATMENT References;
If you don’t already have all of the references open see the following (References)
The summary of scores listed are
from both from the baseline measures 2 and outcome charts. Each of the groups
is labeled and then has several numbers which follow. Confidence intervals and
standard deviations are listed in parenthesis. The numbers always follow the
same order which is; Pre treatment score(standard deviation)-Post treatment
score(Confidence Interval)(standard deviation). Also included in the summary
section is the scale for the measure and any normative (normal values for other
people taking the particular test). What follows these descriptions is the
eyeball analysis of the numbers taking from the referenced charts. It is
probably best to keep the charts open with the above link. This way you can see
how these numbers are displayed in chart form and get used to eyeballing chart
data and deriving meaning.
Summary of Scores for RDQ (Roland
Disability Questionnaire)(Scale=0-24) Comprehensive 8.3(4.2)-2.36(1.2-3.5)(2.8)
Soft 8.6(4.4)-3.44(2.3-4.6)(2.8) Exercise 7.2(5.2)-6.82(4.3-9.3)(5.6) Sham
7.2(4.2)-6.85(5.4-8.2)(3.5) A score of 14 or more is considered a poor outcome.
All of our clients in this study had scores below 14. The scores are reported
in the following order and this instruction shall apply to future summaries.
If you look at the RDQ score in the
comprehensive and soft tissue massage groups it dropped from 8s to 2s and 3s.
There isn’t much of a difference between the comprehensive and soft tissue
groups on these same RDQ scores. Remember the confidence
intervals (CI), they overlap between these scores as a measure of the small
statistical difference between the scores. For example; Comprehensive (1.2-3.5)
Soft-tissue (2.3-4.6). With greater statistical significance between groups
there would be less overlap. Instead of doing a complicated statistical test,
long equations and all you can eyeball the CI to determine whether or not
significant difference exists. When the same comparison is made between the
Comprehensive massage group and the exercise and or sham laser group there is
no overlap of the confidence intervals. For example; Comprehensive (1.2-3.5)
Exercise (4.3-9.3) Sham laser (5.4-8.2). Significant differences do exist
between the comprehensive and exercise sham laser groups but there may be no
differences between the soft tissue group and the exercise group. For example;
Soft-tissue (2.3-4.6) which overlaps slightly with the exercise group (4.3-9.3)
but not with the Sham laser (5.4-8.2). It turns out according to the research
study that by running more complicated statistical tests (F-Test) there were
significant differences between the soft tissue group and the exercise/sham
laser groups on this self-reported disability measure. That teaches us that
when the overlap is slight there still may be some statistical difference. The
“eyeballing” technique of using confidence intervals allows you to draw
tentative conclusions.
The RDQ scores of the exercise pre
and post treatment went from 7.2 to 6.82. The RDQ for the sham laser went from
7.2 to 6.85. The RDQ scores of the exercise and sham laser groups were
virtually unchanged from their baseline scores. Since there is significant
confidence interval overlap between the groups, Exercise (4.3-9.3) Sham laser
(5.4-8.2), it likely that there is no statistical difference post treatment
between these groups on the RDQ disability measure.
Summary of Scores for PPI (Pain
intensity)(Scale=0-5)(Scale=0=No
Pain, 1=Mild, 2=Discomforting, 3=Distressing, 4=Horrible, 5=Excruciating) Comprehensive 2.4(.8)-.44(.6)(.17-.71) Soft
2.2(.8)-1.04(.76-1.3)(.7) Exercise 2.2(.7)-1.64(1.3-2)(.8) Sham
2(.7)-1.65(1.3-2)(.8)
The self rated pain PPI score was
also better post treatment from pretreatment in all of the groups. The
difference in some was greater than others where the difference was slight.
The drop in the pain intensity
score was most dramatic in the comprehensive massage group where the scores
were about 5 times lower post treatment. Soft tissue improved less but still
was about twice reduced from pre treatment scores. There is no overlap of CI’s
between soft and comprehensive but they appear close. This probably means that
there is a significant difference between the groups. If we peek at the outcome
measures results chart there were in fact statistically significant differences
between the comprehensive and soft groups and the comprehensive did
significantly better post treatment on pain intensity. Both comprehensive and
soft had about the same variation of scores as evidenced by their standard
deviations of ½ to 1 point along the pain scale where 68% of the scores would
reside.
Exercise and placebo groups didn’t
do so well post treatment from their baseline score on PPI. They both saw
around a 25% reduction in pain symptoms from baseline and their confidence
intervals not only overlapped but were the same. These two groups were
essentially identical. People in these two groups saw very little reduction in
their pain symptoms post treatment. Their standard deviations were exactly the
same. The CI upper range of soft was the lower range of the exercise group
which might suggest no significant difference and if we look at the outcome
measures results chart the measure of differences between the soft and exercise
group were not reported in the study. It is then unclear whether no significant
differences between these groups exist.
Summary of Scores for PRI Pain
Quality) (Scale=0-79) Comprehensive 12.3(5)-2.92(1.5-4.3)(3.4) Soft
10.6(5.8)-5.24(2.9-7.6)(5.7) Exercise 10.2(6.4)-7.91(5.2-10.6)(6.1) Sham
11.1(5.5)-8.31(6.1-10.5)(5.4)
The comprehensive saw a 5 fold
decrease in PRI scores from pre to post treatment whereas the soft saw only a
50% decrease in PRI scores. The CI between these two groups overlaps
significantly which suggests no statistical differences between the groups and
the outcome measures results chart does not report significant differences. The
variation of scores narrowed between the pre and post comprehensive but stayed
about the same for the soft.
Both the exercise and sham groups
saw about the same 20% reduction in PRI symptoms and their CI nearly overlapped
suggesting no statistical difference between them. The research paper did not
report whether the differences between these two groups was significant (see
the outcome measures results chart).
The standard deviation for all of
the groups was about the same pre treatment to post treatment except in the
case of the comprehensive where we saw a reduction in the standard deviation
post treatment.
Summary of Scores for State Anxiety
(Prior to low back movement)(Scale=20-80) Comprehensive 31.8(9.8)-23.96(22.4-25.5)(3.8) Soft 37.3(10.3)-28.96(25.5-32.4)(8.4) Exercise 32.6(7.5)-30.91(27.9-34)(6.9) Sham 34.1(8.4)-32.54(29.4-35.7)(7.8) The state anxiety Scores can range
from 20 (minimal anxiety) to 80 (maximum). The norms of state anxiety for
working adults are considered to be 35.7 (standard deviation [SD] 10.4) for men
and 35.2 (SD 10.6) for women.
There were no significant statistical differences between the
pretreatment anxiety scores among the various groups. The anxiety scores of
this study appear to be within the normal range of scores. The standard
deviations of comprehensive and soft pretreatment seem similar and within the
normative values whereas the exercise and sham groups seem a little low when
compared to the standard deviation of the normative data.
As with every measure so far the
comprehensive and soft groups did significantly better than the exercise sham
groups, which you can conclude by using just your eyeballs. The reduction from
pre to post was much greater in the comprehensive and soft groups. Doing a
little math will give you the additional information that Comprehensive saw a
23% reduction, soft 22%, exercise 5%, and sham 5% reduction in anxiety scores
from pre to post treatment.
Between groups the comprehensive CI
upper end was the same as the lower end CI for the soft but statistically
according to the outcome measures results chart there are no differences
between these groups post treatment. Similarly, but more dramatically the
confidence intervals (CI) of the exercise and sham overlap almost completely
and there are no reported statistical differences between these groups post
treatment.
Summary of Scores for Schober
Comprehensive 5.6(1.3)-6.36(5.8-6.9)(1.2) Soft 5.2(1.8)-5.87(5.2-6.5)(1.5)
Exercise 5.3(1.1)-5.86(5.3-6.4)(1.3) Sham 5.5(1.2)-5.98(5.5-6.5)(1.2) The ROM (Schober) measure can be
assessed with normative data (Schober test has a norm of about 7 cm (SD 1.2)).
These scores will increase from pre
to post because they represent the increase in ROM that treatment will
hopefully provide. This is the one objective measure of the study conducted by
blinded physical therapists. All of the scores seem a couple of cm short of the
normal mean value of 7 cm. Since the normative value we do have is just a mean
value and doesn’t include a normal range of scores or scores rated for
disability we can’t be certain of our eyeball analysis.
ROM improvements were comprehensive
12%, soft 11%, exercise 10%, and sham 8%. These objective ROM improvements are
rather modest. The CI ranges of all the groups overlap significantly suggesting
no statistical differences between these groups. No statistical differences
were reported in the study. The outcome measures chart reports P-Values of .051
which is greater than .05 and therefore suggesting no statistical differences
between the groups.
The improvements in ROM measures
were not impressive between pre and post treatment or between the groups.
FOLLOW-UP References; If you
don’t already have all of the references open see the following (References)
The author herself
lacked confidence in the follow-up measurements because of the low numbers of
people in each group and loss of subjects due to drop out especially in the
soft tissue group. Look at questions to author in references above question #
5.
Summary of Scores for RDQ (Roland
Disability Questionnaire)(Scale=0-24) Comprehensive 8.3(4.2)-1.54(.69-2.4)(2)
Soft 8.6(4.4)-2.86(1.5-4.2)(3.1) Exercise 7.2(5.2)-5.71(3.5-7.9)(4.8) Sham
7.2(4.2)-6.50(4.7-8.3)(4.2) A score of 14 or more is considered a poor outcome.
The improvements in RDQ from
pretreatment scores were as follows; comprehensive 82%, soft 67%, exercise 21%,
sham 10%.
Eyeballing confidence intervals
reveals significant overlap between comprehensive and soft suggesting no
significant differences between these groups despite the 15% better percentage comprehensive
improvement in disability ratings. Recall that this is a ordinal scale treated
like a ratio scale and so these percentages may not represent a true measure.
The research reports that there were no statistical differences between the
comprehensive and soft groups. The research papers abstract summary incorrectly
cites significant differences between comprehensive and soft "The
comprehensive massage therapy group had improved function...compared with the
other 3 groups." As aforementioned above the body of the research paper
state there are no statistical differences between these groups as inspection
of the overlapping confidence interval further reveals.
The soft and exercise group have
some overlap in their CI scores suggesting no statistical difference (NSD)
between these groups. The comprehensive and exercise have no overlap between
their CI scores and the research study reports significant statistical
differences between these groups. There is a simple explanation for how the
comprehensive and soft can be matched and the soft and the exercise matched but
not the comprehensive and exercise. The comprehensive was on the lower end of
RDQ scores as was its range, the soft was of the more middling range and the
exercise was in the higher range of scores. The lower end scores
(comprehensive) and the higher end scores (exercise) were sufficiently
separated to create a statistically significant difference between the groups.
The CI of the exercise and sham
overlap, suggesting NSD but the sham and soft CIs are sufficiently separated to
infer statistically significant differences between these groups. The research
study confirms statistically significant differences between the soft and sham
groups. (see Outcome Measures Results Chart). The comprehensive and sham have
significant differences between both CI range and statistically as reported in
the research study.
Summary of Scores for PPI (Pain
intensity)(Scale=0-5)(Scale=0=No
Pain, 1=Mild, 2=Discomforting, 3=Distressing, 4=Horrible, 5=Excruciating) Comprehensive 2.4(.8)-.42(.17-.66)(.6) Soft
2.2(.8)-1.18(.52-1.8)(1.5) Exercise 2.2(.7)-1.33(.97-1.7)(.8) Sham
2(.7)-1.75(1.5-2)(.6)
The improvements in PPI from
pretreatment scores were as follows; comprehensive 83%, soft 46%, exercise 40%,
sham 13%. Those reporting no pain at follow-up are as follows; comprehensive
63%, soft 27%, exercise 14%, and sham 0%.
No matter which group you were in
by follow-up your pain intensity level was between mild to near distressing.
The comprehensive group achieved the most pain relief .42 and the sham group
the least 1.75. Comprehensive achieved 2.81 times more pain intensity relief
than the soft tissue group but there is some CI overlap and there was no
statistical difference between the two groups according to the study. Soft was
only 11% better in its pain intensity improvements than exercise and there was
considerable overlap of the CI and no statistical differences were found
between the groups in the study. No CI overlap existed between comprehensive
and exercise and according to the study there were significant statistical
differences between these groups. There was some CI overlap between soft and
sham and between exercise and sham but the study did not report whether these
differences were significant. Just from eyeballing it looks like there may be
no statistical differences between the pain improvement of the soft/exercise
and sham.
Comprehensive did achieve
statistically significant differences in its scores over exercise and sham and
its CI range doesn’t overlap with either exercise or sham.
Summary of Scores for PRI (Pain
Quality) (Scale=0-79)
Comprehensive 12.3(5)-2.29(.5-4)(4.2)
Soft 10.6(5.8)-4.55(2-7.1)(5.7) Exercise 10.2(6.4)-5.19(3.3-7.1)(4.3) Sham
11.1(5.5)-7.71(5.2-10.3)(6)
The improvements in PRI from
pretreatment scores to follow-up scores were as follows; comprehensive 81%,
soft 57%, exercise 49%, sham 31%.
Comprehensive CI overlaps the CI of
soft and exercise but not with the CI of sham suggesting no statistical
differences between comprehensive and soft/exercise but statistical difference
between comprehensive and sham. The research study reports no statistical
difference between comprehensive and soft but does report statistical
difference between comprehensive and sham. The author did not report whether
there was statistical difference between comprehensive and exercise.
Soft CI had significant overlap
with exercise and sham and so there were probably no statistical differences
between these groups although the author only reported no statistical
difference between soft and exercise.
Summary of Scores for State Anxiety
(Prior to low back movement)(Scale=20-80) Comprehensive
31.8(9.8)-23.79(22.2-25.4)(3.8) Soft 37.3(10.3)-30.73(26.4-35.1)(9.8) Exercise
32.6(7.5)-28.81(25.6-32)(7.1) Sham 34.1(8.4)-32.63(29.5-35.7)(7.4) The state anxiety Scores can
range from 20 (minimal anxiety) to 80 (maximum). The norms of state anxiety for
working adults are considered to be 35.7 (standard deviation [SD] 10.4) for men
and 35.2 (SD 10.6) for women.
The improvements in SA from
pretreatment scores to follow-up scores were as follows; comprehensive 25%,
soft 18%, exercise 12%, sham 4%.
The CI for comprehensive did not
overlap with the CI from soft but the upper and lower limits were close. The
study reports no statistical difference between comprehensive and soft on this
measure. Soft, exercise, and sham all overlap significantly (CI) on this
measure but the study does not confirm that there were no differences between
these groups.
Summary of Scores for Schober
Comprehensive 5.6(1.3)-6.47(6-7)(3.8) Soft 5.2(1.8)-5.93(5.3-6.6)(1.4) Exercise
5.3(1.1)-5.39(4.8-6)(1.4) Sham 5.5(1.2)-5.50(4.8-6.1)(1.5) The ROM (Schober) measure can be assessed with normative data
(Schober test has a norm of about 7 cm (SD 1.2)).
The improvements in ROM from
pretreatment scores to follow-up scores were as follows; comprehensive 14%,
soft 12%, exercise 2%, sham 0%.
There was slight overlap between
the CI of comprehensive and soft suggesting no statistical difference between
these groups but just. There was more overlap between CI’s of soft, exercise,
and sham indicating no difference between these groups. P-Values for at
follow-up for these groups indicated significant differences between one or
more of these groups (.04) but no statistical information on the ROM values was
provided in the study. This was due to the authors own decision not to include
this information. See questions to author at the beginning of this paper and
look at question # 5. See aforementioned comments on this development at the
beginning of follow-up results section (Follow-up
Results Intro).
Letters (Summarized
Comments) to the Editor
Lloyd Oppel Emergency
physician Vancouver, BC
Questions the effectiveness of
registered massage therapist vs. non-registered therapists, advises the use of
sham massage instead of sham laser as a control, advises blinding subjects,
self rated function is not the same as actual function, ultimately this study
failed to demonstrate any improvement in actual function which implicates the
result of not blinding subjects/therapists.
Chris Sedergreen, M.D.
Family physician Coquitlam, BC
Improper screening which should
have included physician examination (self-reported criteria unreliable),
Significant pathology should be ruled out (cancer), Vary treatment to age
appropriate, blind the operator of sham laser, analgesic use nullified
randomization, disability compensated patients with secondary gain not
screened, massage therapist/client relationship especially vulnerable to
placebo effects which this study did not seek to dilute.
Analysis
Both physicians pointed out some of
the flaws of this research but missed the essential elements of deception and
possible fraud not only by this researcher but also involving the larger
community of university personnel, Journal Editors ect.
165 people responded to E-Mail/Flyer/advert over an 8 month
period and 107 were selected and about 91 people completed the study which took
about 10 months to write and was published in one of Canada's leading medical
journals in June of 2000 being the first randomized (selected using arbitrary
number assignments to hide the individuals identity) controlled trial (one
group received no treatment) of the effectiveness of massage therapy for sub
acute low-back pain (not serious or severe).
Clients were married, overweight, university educated women
equally split between not working/retired and sitting at a desk/movement who
are in their 40’s who had been suffering with current level of low back pain
for about 3 months which was caused by bending lifting/mild strain injury and
have had previous episodes of low back pain in the past. There were no
significant differences between the groups on sex, age, weight and marital
status, while there may have been differences between the groups on education
level, Occupational Activity, and cause of problem.
Clients were randomly assigned to one of four groups in rough
numbers of 25 in each group with various modality combinations. Group #
1=Comprehensive (soft tissue manipulation and exercise/postural), Group #
2=Soft (soft tissue manipulation only), Group # 3=Exercise/Postural only Group
# 4=Sham Laser only.
Broadly, the modalities (Independent
Variables) were; 1.) Soft-tissue manipulation- Included Friction
Massage (Used for Fibrous Tissue), Trigger Point Therapy (Muscle Spasm),
Neuromuscular Therapy (unspecified) to subject identified areas. Subjects were
simply asked what areas of the low back hurt them and the soft tissue
modalities were applied to that area according to the aforementioned criterion
eg. Friction to fibrous tissue ect. Soft tissue manipulation sessions lasted
between 30-35 minutes for 6 sessions. 2.) Exercise/Postural- 6 sessions for 15-20 minutes of stretching exercises for the
trunk, hips and thighs, including flexion and modified extension for 30 seconds
within pain free range with postural education (postural education and proper
body mechanics instruction). Home exercises included these same stretches twice
one time per day, strengthening or mobility exercises such as walking, swimming
or aerobics and to build overall fitness progressively, and biomechanical
mindedness during daily activities (lifting, sitting, ect). 3.) Sham Laser
(sham low-level laser (infrared) therapy)- This was a real laser machine which
was made to look like it was functioning but was not. Patients were in side
lying with adequate supports to facilitate relaxation. The Laser was held over
the area of patient complaint (within the lumbar area) by the treatment
provider for 20 minutes for 6 sessions over about one month.
The dependent variables included 4 ordinal
(greater or lesser value only-no equal intervals) scale measures (Self Rating
scales) and 1 objective measurement (interval scale=greater or lesser-equal
intervals). The ordinal scale measures are; 1.) Roland Disability Questionnaire
(RDQ) 2.) McGill Pain Questionnaire (PPI) (Present Pain Intensity) 3.) McGill
Pain Questionnaire PRI (Pain Rating Index)(Quality)) 4.) State Anxiety Index
(SA) (State-Trait Anxiety Inventory Form Y (STAI)) The one interval scale
objective measurement was the Modified Schober test (lumbar range of motion).
All of these measures were taken pretreatment, post treatment
and at one month after treatment ended.
The RDQ measured self rated disability on a 24 point scale
with greater numbers representing increased disability and lesser numbers
decreased disability. Subjects were asked to check off the functional
limitations imposed by their back pain. A
score of 14 or more is considered a poor outcome.
The PPI scale measures pain
intensity on a 0 to 5 scale with increasing numbers representing greater pain
intensity and lesser decreased pain intensity.
The PRI scale measures the quality
of pain on a 0-79 with increasing numbers representing more painful qualities
and lesser numbers lesser pain qualities.
The state anxiety (SA) assesses the
level induced by stressful experimental procedures and by unavoidable real-life
stressors such as imminent surgery, dental treatment, job interviews, or
important school tests. Scores can range from 20 (minimal anxiety) to 80
(maximum). The norms of state anxiety for working adults are considered to be
35.7 (standard deviation [SD] 10.4) for men and 35.2 (SD 10.6) for women.
Modified Schober test (lumbar range of motion) is a simple objective measurement of the
distance between two points at mid distance 10 cm superior and 5 cm inferior to
the PSIS midpoint during flexion and extension activities with the centimeter
result recorded for both measurements. Norms have been established. The Schober
test has a norm of about 7 cm (SD 1.2).
The subjects of this study, pre treatment, were reporting
mild disability (RDQ) from their low back pain, a pain level somewhere between
discomforting and distressing (2-3)(Scale=0-5)(PPI), a relatively mild quality
of pain (10-12)(Scale=0-79)(PRI), and a relatively low level of anxiety prior
to low back movements (31-37)(Scale=20-80)(SA).
It seems clients did much better in
the comprehensive massage group and soft tissue group from their baseline
scores and also better than the exercise and sham laser groups when compared.
The comprehensive massage group had significantly better scores than the soft
tissue group on intensity of pain (PPI) post treatment. Comprehensive did
better than exercise and sham on RDQ, PPI, PRI and better than sham on SA. Soft
was better than exercise on RDQ and better than sham on RDQ and PPI.
The author herself lacked
confidence in the follow-up measurements because of the low numbers of people
in each group and loss of subjects due to drop out especially in the soft
tissue group. Look at questions to author in references above question # 5. At
follow-up both the comprehensive and soft tissue massage groups saw significant
lessening of the disability they experienced from their low back pain but their
was no significant difference between these two groups, that is, whether
receiving comprehensive massage or soft tissue clients improved about the same
post treatment. Both the comprehensive and soft tissue groups did better than
the exercise sham laser groups and they did about the same as each other. Both
exercise and sham laser groups did not improve much from pre treatment scores.
Comprehensive did better than exercise and sham on RDQ, PPI and better than
sham on PRI SA. There were no statistical difference between soft and exercise
at follow-up. Soft was better than sham on RDQ.
In the abstract summary the author
implied that at 1 month follow-up comprehensive was statistically superior than
the other three groups on disability (RDQ), Pain Intensity (PPI), and Pain
Quality (PRI) when in fact comprehensive and soft were statistically indistinct
(no statistical differences) on all these measures. Comprehensive was also no
better than exercise on PRI. Comprehensive was statistically superior to
exercise and sham on RDQ and PPI. Comprehensive was also superior to sham on
PRI. In addition the author used questionable percentage statistics to report
no pain ratings at follow-up on the PPI intensity scale knowing that these
statistics may be inaccurate due to high drop out rates in the soft group. The
author also reported in same summary report that patients with subacute low
back pain benefited from massage therapy (same as provided to the Comprehensive
massage group) from experienced massage therapists who were CMT registered when
CMT registration, education and or experience were not measured variables in
this research project.
The author utilized several
deceptive practices which suggest conscious intent to mislead the reader into
accepting false conclusions. In particular, she implied statistical
significance when there was none especially between the comprehensive and soft
groups by using deceptive and targeted statistical reporting. This included
placing misleading information in the abstract summary where hurried readers
could be easily mislead. The author also used percentage of no pain reporting
as a follow-up scientifically unproven statistic knowing that this measure was
probably invalid due to high drop out rates and small sample sizes. The author
blatantly plugged the research institution which funded the research by
suggesting the study showed that experienced massage therapists registered by
this institution (CMT) benefited subacute low back pain. This interpretation by
the researcher is an untruth because this research project did not determine
whether experience, education, or institutional registration status benefited
subacute low back pain. The combined accumulation of several deceptive
practices does not suggest that these were random clerical errors or oversights
but rather reveals a pattern of conscious intent to deceive on the part of the
author of this study. Further it seems likely that those who reviewed this
study must have known or should have known that these unethical research
practices were evident and these same reviewers should have forced revision of
the study. None of the reviewers of this study which may have included
University Personnel (University of Toronto), Peer Reviewers (CMAJ), and
editors of Canada’s
leading medical journal (CMAJ)
forced revision. Further the College of Massage Therapists, the source of
funding with its pledge to honesty should also have caused revision of this
study. As far as can be determined none of these unethical practices were
challenged or changed. This seems to at least in the case of this study imply a
system of checks and balances which is broken and or hijacked by business
interests over science. Both physicians (Oppel, Sedergreen) who correctly
pointed out, in their letters to the editors, some of the research and design
flaws, failed to note the patterns of deception and possible research fraud.
Although the aforementioned pattern of deception which
implies conscious intent but are these fraudulent practices, that is do they
harm anyone. By the incomplete and summarized definition of fraud offered by
just one university source (Caltech) this research study is not fraudulent.
That is there is no evidence of “faking data, plagiarism (coping others work),
or misappropriation (stealing) of ideas”. It would probably be considered fraudulent
though by most university sources if you include misleading the reader to false
conclusions which may be equally harmful to the public and science in general.
By the legal definition of fraud this study is probably fraudulent. That is,
“….false suggestions or suppression of the truth”, for the purpose of fooling
or cheating people to the advantage of the perpetrator. In this case the
researcher wants us to become registered massage therapists by the College of
massage therapists (funding source) and go to schools that teach some form of
comprehensive massage therapy (combine soft tissue and exercise) and wants
clients to pay for more expensive therapy. The harm here is financial, in that,
prospective students may pay money for education they don’t need and clients
may spend more money and time than needed on unnecessary therapy. Science is
harmed since massage research may not be trusted unless more expensive research
and design measures are employed thus reducing the amount of research because
it is more costly to do with limited research funds.
All things considered does this study contribute to the
scientific understanding of the effect of soft tissue massage alone, exercise
alone and in combination with each other on subacute low back pain? Although
combining soft tissue manipulation with therapeutic exercise does seem to
provide some greater pain relief that benefit disappears at follow-up where
there are no differences between the combo of soft/exercise and soft alone. By
all of the other measures there are no statistical differences between
comprehensive and soft at follow-up.
By eyeballing the data it does appear that comprehensive is
better than soft, exercise and sham, these statistics are suspect given the
clear patterns of the author’s conscious deception and apparent fraudulent
practices as well as the high drop out rate in the soft group at follow-up. We
are left with muddled and contradictory conclusions as a result of misleading
research practices. Future studies should avoid catering to business interests
over sound ethical research. It does both harm to the public interest and to
the profession of massage therapy. Any short term gains to the careers of
individual researchers or institutions are lost to the long term mistrust by
the greater scientific community and by the public.
NOTES ON READABLITY OF THIS ANALYSIS
Sentences per Paragraph 6.6
Words per Sentence 21.1
Character per Word 5
Flesch Reading Ease 44.4
Rates text on a 100-point scale; the higher the score, the easier
it is to understand the document. For most standard documents, aim for a score
of approximately 60 to 70. The formula for the Flesch Reading Ease score is:
206.835 – (1.015 x ASL) – (84.6 x ASW) where: ASL = average sentence length
(the number of words divided by the number of sentences) ASW = average number
of syllables per word (the number of syllables divided by the number of words)
Flesch-Kincaid Grade Level 12.1
Rates text on a U.S. grade-school level. For example, a score
of 8.0 means that an eighth grader can understand the document. For most
standard documents, aim for a score of approximately 7.0 to 8.0. The formula
for the Flesch-Kincaid Grade Level score is: (.39 x ASL) + (11.8 x ASW) – 15.59
where: ASL = average sentence length (the number of words divided by the number
of sentences) ASW = average number of syllables per word (the number of
syllables divided by the number of words)
Passive Voice= 17%Passive voice=Subject Receives Actions.
Active Voice=Subject performs action.
Juanita was delighted by Michelle. Michelle Delighted
Juanita. Eric was given more work. The Boss gave Eric more work. The garbage
needs to be taken out. You need to take out the garbage
26119=74